NBMG Report 53
Geologic Assessment of Piedmont and Playa Flood Hazards in the Ivanpah Valley Area,
Clark County, Nevada
P. Kyle House1, Brenda J. Buck2, Alan R. Ramelli1
1Nevada Bureau of Mines and Geology,
University of Nevada, Reno
2Department of Geoscience, University of Nevada Las Vegas
2010
Prepared in cooperation with the Clark County Flood Control District and the U.S. Geological Survey Statemap Program
Table of Contents
- List of Figures
- List of Tables
- Abstract
- Introduction
- Piedmont Geomorphology and Related Flood Hazards
- Geomorphology of Alluvial Fans
- The Problem of Flooding on Desert Piedmonts and the Role of Geologic Mapping
- The Field Area
- Expected Land Use Issues in Ivanpah Valley, Nevada
- The Geologic Map
- Geologic Maps vs. Soil Maps for Flood Hazard Assessment
- Previous Work
- Compilation Methods and Base Data
- Quickbird® Data
- Field Data Collection
- Mapping Criteria
- Stratigraphic Relationships
- Topographic Characteristics
- Drainage Pattern
- Surface Morphology
- Characteristics of Desert Soil Development and Surface Clast Weathering
- Soil Carbonate Development
- Desert Pavement Development
- Surface Clast Weathering
- Descriptions and Examples of Ivanpah Valley Map Units (House et al., 2006)
- Statement on Nomenclature
- Anthropogenic Features and Deposits
- Playa and Related Deposits
- Aeolian Deposits and Related Deposits
- Hillslope Deposits
- Alluvial Deposits
- Bedrock Units
- Age Estimates of the Surficial Units
- Las Vegas and Pahrump Valleys
- Eastern Mohave Desert
- Nevada Test Site and Vicinity
- Mormon Mesa Area
- Flood Hazard Interpretation of the Geologic Map
- Relative Flood Hazard Classes
- General Geologic Assessment of Flood Hazards in the Ivanpah Valley Area
- References
- Acknowledgments
- Appendix 1. Explanation of digital data sets associated with this report
Abstract
A comprehensive surficial geologic mapping effort was undertaken to support the development of a series of relative flood hazard maps of the Ivanpah Valley area, Clark County, Nevada. The study area spans approximately 1030 km2 (398 mi2) and is defined by all of three and part of one internally drained basins between Las Vegas and Primm, Nevada. The proximity of the study area to Las Vegas makes it a likely site of urban and suburban development in the near future, and it is currently being considered for the construction of a major airport facility. The geologic study focused on the delineation of surficial deposits of alluvial, aeolian, and playa sediments ranging in age from recent to late Miocene (approximately 5.6 million years old). Mapping emphasized the discrimination of active alluvial and playa surfaces from relict, inactive surfaces for the purpose of developing a relative flood hazard characterization to provide a baseline physical data set to guide floodplain management and more detailed studies related to hazard mitigation efforts in the area. Ideally, the maps will help planners understand the distribution of flood hazard conditions in the valley and direct mitigation efforts and engineering studies to areas with the highest potential for flooding. Study results indicate that 60% of the total study area (236 mi2) is composed of surficial geologic deposits. Within that subset, nearly 75% (175 mi2) is subject to a relative flood hazard level deemed greater than “none”, and nearly 53% of that area (125 mi2) is classified as having a hazard status high enough to represent a significant concern for floodplain management. A series of 9 maps and a complete digital GIS dataset accompany this report.
Introduction
This report describes the application of surficial geologic mapping to flood hazard assessment on desert piedmont and playa surfaces in the Ivanpah Valley area along the I-15 corridor between Las Vegas, Nevada and the California border. It is a descriptive summary of and companion to a GIS data set that has been previously published as 9 separate paper maps (2 maps of the entire area and 7 maps of parts of the area that correspond generally to 7.5 minute quadrangle boundaries). The first map (House et al., 2006) is the surficial geologic map of the study area, and the second (House, 2007) is a qualitative flood hazard assessment of the study area (both at printed scale of 1:50,000). The seven remaining maps (House, 2006b through 2006h) are depictions of the flood hazard classifications on a series of 1:24,000-scale panels that cover the entire study area. The maps and their underlying data will serve as a useful guide for addressing flood-hazard management issues. At a minimum the mapping provides a useful template for determining the location and extent of areas of greatest concern to engineers and land managers responsible for flood hazard assessment and mitigation. These maps are not regulatory maps or actuarial flood hazard maps, but were developed with the intention of illustrating the spatial array of flood hazardous areas in the valley through the geologic interpretation of landforms, sedimentary deposits, soil characteristics, and surface morphology.
Flood-hazard management on desert piedmonts and terminal playas is a particularly challenging task. Desert piedmonts are crossed by ephemeral flow networks that occasionally convey high-velocity flows through a complex array of steep, potentially unstable and highly mobile, alluvial channels. These channels may follow a single, commonly braided thread or may be part of a multi-branched distributary network. Playa surfaces are inundated sporadically with shallow, standing water from a wide range of possible sources. Playa inundation may persist for days to weeks. Difficulties in characterizing floods in these settings also arise from limited amounts of measured data on flow frequency and hydraulics. Rapid urban and suburban growth often further exacerbate the problem by impacting already poorly understood temporal and spatial patterns of runoff and sediment transport while also creating a pressing demand for effective flood hazard mitigation.
Conventional concepts of floodplain management (i.e., as related to perennial streams) do not transfer to desert piedmonts. Numerous studies over the last 20 years have indicated that regulatory models for and approaches to flood hazard assessment on desert piedmonts can produce erroneous results when they ignore geologic information (e.g., Baker et al., 1990; Fuller, 1990; Pearthree, 1991; House et al., 1991, 1992; House, 2005; NRC, 1996; Robins et al., 2009).
Piedmont Geomorphology and Related Flood Hazards
Piedmont is the non-genetic term for a typically broad, generally low-relief area extending from the base of a mountain range toward the center or axis of a valley. The valley axis may host an axial stream, river, or wash; or a lake or playa. The latter is the situation for piedmonts in Ivanpah Valley. Piedmonts are composed mostly of alluvial sediment shed from adjacent highlands by streamflows and debris flows that form complexly coalescing and overlapping deposits and landforms of alluvial fans; but they may also include complex mixtures of eroded bedrock and other kinds of surficial geologic deposits, including: well-defined washes, inactive alluvial fan remnants, river terraces, pediments, sand dunes, sand sheets, spring mounds, and lacustrine beach forms. The mosaic of surficial geologic deposits and geomorphic surfaces that form desert piedmonts contain a geologic record of long-term effects of flooding, climate change, and tectonic activity. The various components of the piedmont can have widely varying ages. The array of landforms and geologic deposits on a particular piedmont is dictated by local conditions and the cumulative effects of geologic and climatic history on overall topography, sediment yield, and the types, rates, and magnitudes of surficial processes.
With respect to floodplain management concerns, the distinction between active and inactive alluvial fans is of greatest and most immediate relevance. Awareness and recognition of other types of deposits and landforms can be very useful for interpreting piedmont history, geomorphic process dominance, and long-term stability. Thus, describing, mapping and understanding the geomorphology and recent geologic history of desert piedmonts is an important part of understanding their flood hazard.
Geomorphology of Alluvial Fans
Alluvial fan flooding is the greatest concern of piedmont flood hazard management. Alluvial fans have been the topic of geologic research for a long time, and there is a correspondingly rich record of related scientific literature (c.f., comprehensive summary in Blair and McPherson, 1994). In the last twenty-five years or so, descriptions and analyses of alluvial fans and desert piedmonts have appeared frequently in the context of floodplain management because of the growing awareness and impact of the problem of alluvial fan flooding on piedmonts (e.g., Dawdy, 1979; French, 1986, 1987; Hjalmarson and Kemna, 1991; NRC, 1996, FEMA, 2000; House, 2005; Robins et al., 2009).
The Federal Emergency Management Agency (FEMA) has a vested interest in the characterization and management of piedmont flood hazards and the definition of alluvial fans and alluvial fan flooding. FEMA (2000, p. 6; and NRC, 1996 pp. 6–7) formally defined an alluvial fan as “...a sedimentary deposit located at a topographic break such as the base of a mountain front, escarpment, or valley side, that is composed of stream flow and/or debris flow sediments and has the shape of a fan, either fully or partially extended.” This definition is accompanied by physically based distinctions between active and inactive alluvial fans and their respective flood hazards. These distinctions reflect the ranges of fan geometry and geomorphology on most piedmonts by emphasizing different types of flooding characteristic of active and inactive fans, including stable channel flooding (inactive fans), sheetflow (active fans), debris flow (active fans), and unstable flow path flooding (active fans).
In aerial view, alluvial fans often resemble extended fans, or conic segments (Bull, 1964, 1977); however, the gross planimetric geometry of fans can range from relatively ideal fan shapes to more irregular forms bounded by adjacent fans, bedrock outcrops, and relict fan surfaces, among other possibilities. Even when their shape is elegantly expressed, many alluvial fan landforms are comprised of a mosaic of alluvial deposits that record the evolution of the landform over periods of time in excess of several 100,000s of years (e.g., Ritter et al., 1993; Peterson, 1981).
Alluvial fans are created by sediment erosion, transport, and deposition by stream flows, debris flows, or both. Fans are composed of sediments ranging in size from silt to boulders and are built over time through net deposition of alluvium by a complex and dynamic network of distributary channels of varying dimensions and with varying degrees of lateral confinement. Fans form where a stream channel crosses a transition from a confined channel to a less-confined, but commonly similarly steep channel where the area of flow can expand relatively freely. Below the point of expansion, sediment is deposited over a broad area as the trunk channel widens and diverges into multiple distributary channels. Flow processes that create alluvial fans range from sediment-laden water flows to highly viscous, sediment-charged debris flows. Many fans are composed of deposits from both processes (composite fans), and some are composed largely of deposits from one or the other (Blair 1999a, 1999b).
The position, shape, and size of an alluvial fan collectively represent an approximate balance in the long-term relationship between delivery of sediment to the system, the system’s transport competence and capacity, and the influence of bounding features on patterns of erosion and deposition (Bull, 1979). Repeated, large-scale changes in regional climate can profoundly influence this balance by altering watershed sediment yield and watershed runoff in different ways (e.g., Bull, 1991). Active tectonics, base-level changes along a master axial stream, or lake-level changes can also have major impacts on alluvial fan dynamics (Ritter et al., 1995). The result is a potentially complex assemblage of alluvial fan landforms spanning thousands to hundreds-of-thousands to millions of years on a given piedmont.
The Problem of Flooding on Desert Piedmonts and the Role of Geologic Mapping
Flooding on active alluvial fans involves high velocity, sediment-laden, and erosive flows that may follow multiple paths simultaneously (e.g., French, 1987). Flow path locations may shift position during floods and even between floods owing to effects of intervening lower magnitude flows. This presents an obvious complexity and uncertainty to hazard characterization and management on alluvial fans and the piedmonts they comprise. Individual alluvial fan floods may result in surface changes and drainage pattern alterations that invalidate subsequent use of pre-flood topographic and hydraulic assumptions. One key contribution of geologic mapping in this context is that it can summarize a suite of physical criteria that indicate where alluvial fan activity has and has not occurred over very long periods of time, thus indicating areas of highest hazard potential.
The utility of geologic studies in this context was explicitly recognized by FEMA (2000) in their recommended 3-step approach to alluvial fan flood hazard determination:
- Recognition and characterization of the alluvial fan landform.
- Defining the nature of the alluvial fan environment and the location of active erosion and deposition.
- Defining and characterizing areas of “100-year” alluvial fan flooding.
Steps one and two above require geologic interpretation and are best handled with detailed mapping and field reconnaissance. Step three requires detailed technical engineering studies to ultimately develop Flood Insurance Rate Maps (FIRMs). Thus, it is critical to note that geologic data alone are inadequate for developing regulatory maps. Geologic maps provide an informal perspective on the distribution and relative severity of piedmont flood hazards, but they do not supplant conventional flood-risk maps because they do not contain explicit data on flow depths, velocities, or probabilities. Those types of parameters cannot be reliably determined from geologic studies.
The Field Area
The Ivanpah Valley study area includes the entirety of three internally drained valleys and a small part of one internally drained valley southeast of Las Vegas, Nevada (fig. 2 and fig. 3). Each valley is associated with drainage to a specific playa lake: Hidden lake (informal name), Jean Lake, Roach Lake, and Ivanpah Lake. Only a small part of the Ivanpah Lake drainage is included in the study as explained below.
The terminal “lakes” or “playas” in each valley are dry most of the time in any given year. The four playas are aligned along a roughly SW–NE trend that likely reflects control by deep-seated geologic structures. Roach and Ivanpah playas are separated by a low and potentially transient divide formed where the southern extremity of the Spring Mountains meets the toe of a large alluvial fan that extends westward from a deep canyon cut through the Lucy Gray Mountains (the Lucy Gray fan). The lowest part of the divide is obscured by development in Primm, NV, but is less than 1 mi. north of the California state line. Geologic evidence unequivocally indicates that the alluvial divide is transient and has been crossed multiple times by large channels on the Lucy Gray fan. The study area includes the part of the Lucy Gray fan that lies in Nevada and drains to Ivanpah Lake because it includes surficial deposits that represent conditions that could have just as easily affected the Roach Lake basin.
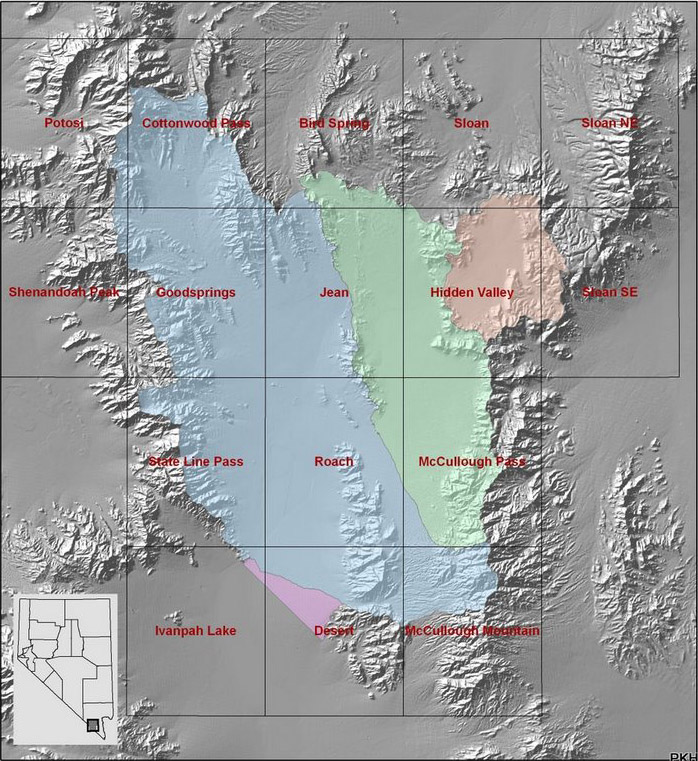
Figure 1. Shaded relief map of Ivanpah Valley study area (colored) showing 7.5’ quadrangle maps and playa watersheds (blue: Roach; green: Jean; peach: Hidden Valley; pink: Ivanpah). The shaded relief is based on 30-m digital elevation data from USGS.
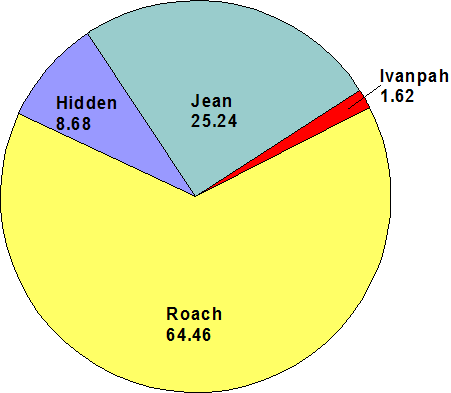
Figure 2. Individual playa drainage areas as percentage of study area.
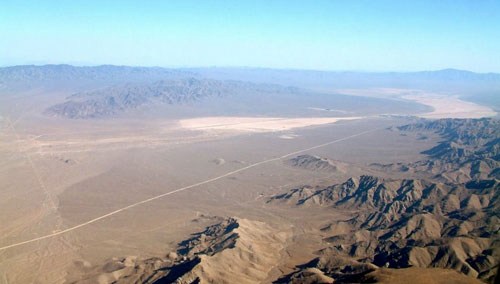
Figure 3. Oblique aerial view of the southern part of the Ivanpah Valley study area. Photographer in airplane situated over the Spring Mountains looking SSE. Roach Playa is prominent playa in center of image; Lucy Gray Mountains and McCullough Mountains in left background; Table Mountain in lower right corner. Photo courtesy of Jim Faulds, NBMG.
Expected Land Use Issues in Ivanpah Valley, Nevada
Construction of a major airport facility on the Roach playa and immediately surrounding low-lying areas has been proposed. A development of this scale will have a significant effect on local drainage. It is also likely that addressing these effects will involve flood hazard mitigation efforts on piedmont areas throughout much of the study area. The construction of the airport would also result in a vastly enhanced utility and transportation infrastructure in the valley that would likely stimulate additional development, much of which would occur on piedmont surfaces. Piedmont and playa areas comprise 60% of the study area. Results from this study indicate that more than 50% of that area pose significant floodplain management concerns.
The Geologic Map
Surficial geologic mapping focuses on the differentiation and delineation of largely unconsolidated sedimentary materials that comprise a surficial veneer over bedrock. Most of these types of deposits in the Mohave Desert are Quaternary in age, a geologic period spanning from the present to approximately 2.6 Ma (million years ago) (USGSGNC, 2007; ICS, 2008) (http://www.stratigraphy.org/upload/ISChart2009.pdf). It is notable, however, that there are extant surficial deposits that may date to as early as the late Miocene (>5.3 Ma) are present in some locations in southern Nevada, including Ivanpah Valley. In this study, the division between deposits mapped in detail and those mapped only generally corresponds to a major geologic unconformity between strongly tectonically deformed deposits (this includes all bedrock units and one Miocene age alluvial deposit) and deposits that are weakly deformed or undeformed.
The previously published geologic map that accompanied the development of this report (House et al., 2006) depicts the distribution of geomorphic surfaces and their associated surficial sedimentary deposits. Geomorphic surfaces are landscape elements that have formed (or are currently forming) during discrete periods of time by an identifiable set of geologic processes (e.g. deposition of alluvium or aeolian sediment). Geomorphic surfaces have distinctive material composition, topographic features, soil profiles, weathering characteristics and stratigraphic relations that can be used to differentiate them by relative age and formative process (Bull, 1991, p. 51). Abandonment of a geomorphic surface by its principal formative processes subjects it to prolonged subaerial exposure and weathering. The duration of exposure is reflected in progressive physical changes in surface properties related to physical and chemical weathering and, quite importantly in this setting, the persistent but variable additions of fine-grained windblown sediment to stable surfaces. The effects of these processes comprise the set of mapping criteria that are used to develop surficial geologic maps of desert piedmonts.

Figure 4. Surficial geologic map of the Ivanpah Valley area (House et al., 2006). Greatly reduced representation.
Download Surficial Geologic Map: |
|||||
Google Earth Version (.kmz) |
|||||
|
|
||||
Geomorphic surfaces are usually associated with roughly contemporaneous geologic deposits, but not universally—and this is why the distinction is important. Time-correlative geomorphic surfaces are those that were abandoned by active surface processes at the same general point in time and have thus been subject to the same duration of weathering and soil formation; however, the underlying deposits are not necessarily the same age as the surface and it is common for younger surfaces to be associated with older deposits if, for example, the older deposits have been exhumed by erosion. Thus, surface age represents the minimum deposit age, or the duration which the extant deposit surface has been isolated from active constructional processes and exposed to largely uninterrupted weathering and soil development (Peterson, 1981). Surficial geologic maps emphasize surface age over deposit age unless the exposure of an older, underlying deposit is extensive enough to depict on the map at the chosen scale.
Geologic Maps vs. Soil Maps for Flood Hazard Assessment
Various types of maps may be relevant to piedmont flood hazard evaluation, but their specific applicability can vary. Many available geologic maps emphasize bedrock geology and only depict surficial geologic deposits very generally. This type of geologic map has minimal value for flood-hazard characterization. Soil maps (available through the National Resource Conservation Service, NRCS) are available for many areas, and these are also useful for flood-hazard studies; however, it is important to be aware of fundamental differences between surficial geologic maps and soil survey maps and how they relate to piedmont flood hazard characterizations.
Soil survey maps produced by the NRCS are useful and important tools for land-use planning. They contain information that can predict soil behavior for different land uses; they give information regarding soil hazards, soil limitations and methods to overcome those limitations, and predicted environmental impacts from selected land uses. Soil surveys provide detailed descriptions of soils; slope steepness, length, and shape; pattern of drainage; and vegetation. Soil mapping units are identified according to the taxonomic classification of the dominant soil present, but commonly include one or more lesser soils. Classification of soils is based on numerous specific and well-defined properties.
Soil survey maps and surficial geologic maps share both strong similarities and potentially significant differences. Similarities occur where one or more soil-forming factor (parent material, biota, climate, time, topography) has resulted in significant changes in the soil characteristics and significant controls on geomorphic processes. An example of this is where the age of different geomorphic surfaces is significant enough that soils forming on those surfaces have distinctly different features or properties that place them into different taxonomic classifications. Therefore, depending upon the scale of the two types of maps, both the soil survey and the surficial geologic map could have very similar delineations because the difference in age is great enough to affect both the geomorphic characteristics of the landform as well as the soil forming upon it.
On the other hand, clear delineations can often be made using geomorphic data that do not correlate well with soil characteristics used in soil taxonomy. For example, in many places, two or more geomorphic units can be distinguished in a surficial geologic map based upon topographic and crosscutting relationships. However, these geomorphic surfaces may contain soils with similar diagnostic characteristics such that they are all mapped as one soil series in a soil survey. Another example is where an active geomorphic surface has eroded into older deposits. Because of the depth considerations required by soil classification (the uppermost 5 feet of the subsurface), a soil profile excavated into a modern, active channel may encounter a buried, older soil at shallow depths. In this case, the characteristics of the older soil will control the classification of that soil and resulting map unit (Robins et al., 2009).
Surficial geologic maps rely on a set of multiple criteria (soil development being only one) that allow for a finer division of surficial deposits by age and formative process; whereas soil maps focus on specific set of physical criteria contained in the soil which can be related to age and formative process, but not to the same extent. Access to both types of maps for any given area is obviously an advantage in land management applications.
A specific comparison of the Ivanpah geologic maps (House et al., 2006; House, 2007) and soil maps of the same area prepared by the NRCS is described in a recent paper by Robins et al. (2009). Their paper provides important context for evaluating the relative merits of the different approaches, applications, and intentions of these two types of maps.
Previous Work
Previous geologic mapping efforts in the Ivanpah Valley area have focused on characterizing the geologic setting of ore deposits, describing key Paleozoic and Mesozoic rock units, and mapping complex geologic structures (Hewett, 1931, 1956; Longwell et al., 1965; Burchfiel et al., 1974; Carr and Pinkston, 1987; Kohl, 1977; DeWitt et al., 1989; Bridwell, 1991). A recent exception to the emphasis on bedrock geology is a surficial geologic map of the Mesquite Lake 30’x60’ quadrangle (1:100,000-scale) that includes the Ivanpah Valley study area (Schmidt and McMackin, 2006). That map covers a considerably larger area and is thus more general than the mapping associated with this report (House et al., 2006), but it provides a useful perspective on the regional geologic context of the Ivanpah Valley area. It is accompanied by a comprehensive report that presents detailed background information on vegetation, climate, the range of surficial processes in the region, and additional discussions of concepts of soil formation over time that are representative of general conditions in Ivanpah Valley.
Compilation Methods and Base Data
The geologic data depicted in House et al. (2006) were compiled digitally in ESRI ArcGIS software using a combination of base material sources. Orthorectified aerial photograph mosaics (U.S. Geological Survey orthophoto quarter quads, DOQQs) and orthorectified Quickbird® satellite imagery were used extensively to guide digital linework compilation. In most cases, mapping was performed using “heads-up” digitization on desktop computers. In a few cases, preliminary linework was compiled using a PG-2 stereographic plotter. Linework developed using this technique was ultimately refined on-screen with underlays of high-resolution satellite imagery. Digital raster graphic (DRG) images of fifteen, 1:24,000-scale topographic maps served as base maps for linework. The 1:50,000-scale topographic base upon which the map is overlain was compiled from various digital sources that were derived from the 1:100,000-scale Mesquite Lake 30’ x 60’ USGS quadrangle. Minor modifications to road alignments were made to these data from the basis of high-resolution imagery and the 1:24,000-scale base maps.
Some of the basedata sources (described below) allowed for compilation of geologic linework at large scales (up to 1:4000-scale), but mapping at this level of detail was not performed universally in the study area due to data availability issues and basic logistical constraints on time. Overall, the mapping is accurate down to approximately 1:12,000-scale, with the exception of the areas mapped in the Cottonwood Pass and McCullough Mountains quadrangles which are based on less field reconnaissance than the rest of the map and are accurate to approximately 1:24,000-scale. The base imagery and final mapping are based on the North American Datum of 1983 (NAD 83).
The geologic data were initially compiled using a combination of field reconnaissance and interpretation of various types of remotely sensed imagery, including: aerial photographs, digital orthophoto images, Quickbird® satellite imagery, and digital, orthorectified color aerial photographs. Details about the various aerial photograph sources are listed in table 1.
Table 1. Aerial photographs used in compiling geologic data.
Film Type |
Source |
Series |
Date |
Scale |
b/w |
USGS |
GS-YP |
1953 |
1:18,000 |
b/w |
AMS |
VV HU M |
1954 |
1:50,000 |
b/w |
USGS |
GS-VUZ |
1958 |
1:52,000 |
b/w |
USGS |
GS-VEFB |
1976 |
1:76,000 |
b/w |
USGS |
NAPP |
1999 |
1:40,000 |
color |
BLM |
FY-76 |
1977, 1978 |
1:18,000 |
Quickbird® Data
Toward the end of the mapping project, we obtained Quickbird® satellite imagery for nearly the entire study area (fig. 4). Quickbird® is high-resolution commercial satellite capable of 61–72 cm panchromatic resolution and 2.44–2.88 m multispectral resolution (Toutin and Cheng, 2002). Most of the Quickbird® data acquired in this project were 4-band, 8-bit and 3 band natural color, and orthorectified (Digitalglobe Corp., 2006). When adequately post-processed, Quickbird® images have exceptional clarity and resolution and are thus excellent resources for surficial geologic mapping. The vastly improved orthorectified base data allowed for extensive remapping of areas previously mapped using only aerial photos and grayscale DOQQ datasets. It also facilitated relatively rapid mapping of areas added to the mapping task in the final year (this applies to mapping in the parts of the Cottonwood Pass and McCullough Mountain quadrangles which were added to the scope late in the project to ensure that the entire watershed of the Nevada part of Ivanpah Valley was mapped).
Field Data Collection
We collected GPS coordinates for all sites of key observations during field work. The data were collected in (or ultimately converted to) UTM NAD 83. Over the course of the project, our technique for collecting site location data in the field evolved significantly from point coordinate collection using handheld GPS units to collection using handheld computers running ArcPad to collection using ruggedized GPS-enabled laptop computers running ArcGIS. All field sites at which notes were collected and several where ground photographs were taken are recorded in a corresponding geodatabase included with this report (see appendix 1). A subset of field photographs was geotagged, (i.e., encoded with latitude and longitude), and these photos are available online and viewable in Google Earth.

Figure 6. Generalized geologic map of study area also showing locations of recorded field observations by the authors.
Mapping Criteria
Geomorphic surfaces and related sedimentary deposits in the Ivanpah Valley area were discriminated by their relative ages as inferred from observable physical characteristics, including the following: landscape position; surface morphology; surface material weathering; soil development; and stratigraphic relations. Broad age assignments are based on comparison to regional studies of soil and surface characteristics, some with independent sources of age control (described in a subsequent section). A set of useful guidelines for mapping alluvial fans, both in the context of interpreting Quaternary geology and evaluating flood hazards, can be gleaned from the geologic literature (e.g. Christenson and Purcell, 1985; Dohrenwend, 1987; Bull, 1991; Field and Pearthree, 1997). Compilation of geologic data for application in piedmont flood hazard assessment requires a specific emphasis on surface characteristics that develop only in the absence of sediment entrainment, transport, and deposition associated with active alluvial fan and ephemeral wash processes. The following criteria apply in varying degrees to the Ivanpah Valley study area (cf., Field and Pearthree, 1997, table 1, for comprehensive reference list).
Stratigraphic Relationships
Desert piedmont deposits are composed of stratified (layered) sediments (gravel, sand, and mud) transported by flowing water or debris flows (alluvial deposits), wind (aeolian deposits), by settling from standing water (playa deposits), and by physical weathering and mass wasting of steep bedrock cliffs and slopes (colluvial deposits). The basic stratigraphic relationships among and between different geological units of known or approximately known ages can be used to establish a relative age framework. Evaluation of the superposition of map units in stratigraphic section or in their surface distribution were used in this study, for example: cross-cutting surficial relationships among alluvial fan units, inset geomorphic relations, and degree of overlap or burial by aeolian deposits.
Topographic Characteristics
Piedmont alluvial surfaces of different ages can be distinguished in many cases from the basis of large-scale and small-scale topographic characteristics. Local arrays of piedmont alluvial surfaces of different ages commonly exhibit observable topographic separation and inset or nested relationships. Examination of field relations and aerial-photo stereopairs can help relate the topographic separation to relative degrees of connectedness or non-connectedness between alluvial surfaces and active channels, for example, and can help correlate map units across large parts of the field area. Depth of channel dissection on a given abandoned alluvial surface generally increases with increasing time. Inactive surfaces are often associated with networks of incised stable channels.
Drainage Pattern
Active alluvial surfaces on desert piedmonts commonly have obvious distributary, braided, or anabranching drainage patterns or are well-defined single channels. Inactive alluvial surfaces are characterized by superposed dendritic, or flow-concentrating, tributary drainage patterns that reflect progressive erosion by local surface runoff or by moderately to deeply incised active channel systems. As noted above, tributary drainage networks on inactive fan surfaces often have incised channels that generally increase in depth with increasing relative surface age, although this can vary with landscape position. In most circumstances, older abandoned surfaces are most deeply dissected in upper piedmont areas and dissection progressively decreases toward the valley axis where the toes of remnant fans are commonly buried by younger abandoned surfaces and modern active surfaces.

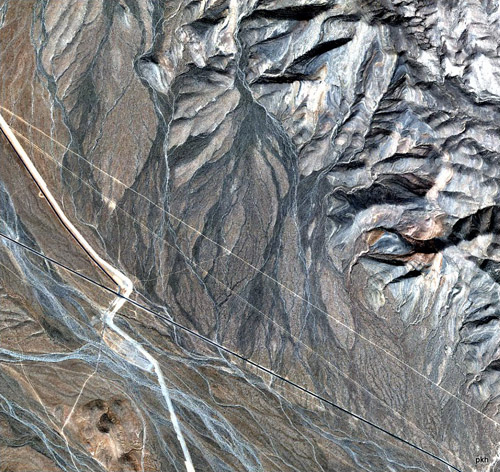
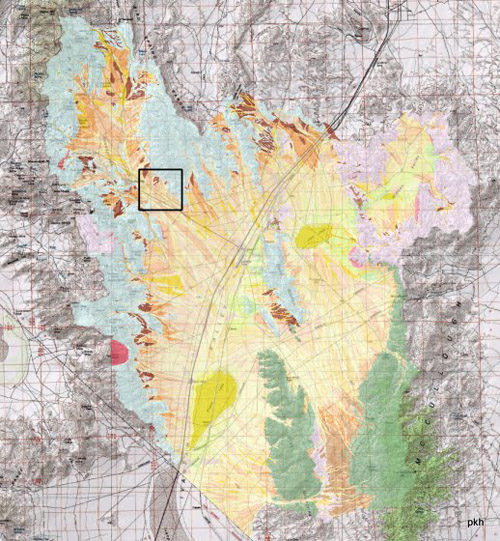
Figure 7. Examples of tributary v distributary drainage pattern, inset topographic relationships, and the the value of Quickbird® imagery for interpreting geologic relations. Red box in third image indicates location of large-scale map and image.
Surface Morphology
The deposition of coarse-grained alluvium in channels and on alluvial fans results in distinctive bar and channel forms composed of sand and gravel (fig. 11). This pristine condition of the surface is referred to as “bar-and-channel” morphology and it reflects active fluvial processes of sediment transport and deposition. Relief between bar crests and channel floors can approach 1–2 meters on some active surfaces, rarely more. Once an active surface is abandoned by fluvial processes, subaerial weathering processes proceed to mute the original surface relief and change the character of sedimentary particles on the surface. Observable changes include the following: progressive flattening of original depositional surface morphology with time; formation of desert pavements that generally become more tightly interlocked with time; development and progressive darkening of rock varnish; and chemical and physical disintegration of surface rocks. Each of these phenomena is a time-dependent changes that has been extensively documented and described on abandoned alluvial surfaces in arid regions (e.g., McFadden et al., 1998; Wells et al., 1998). These characteristics are among the easiest to observe in the field and on remote imagery. Their relative strength reflects varying amounts of time, and they are particularly useful criteria for establishing relative age relationships (e.g., Bull, 1991).
 |
 |
 |
 |
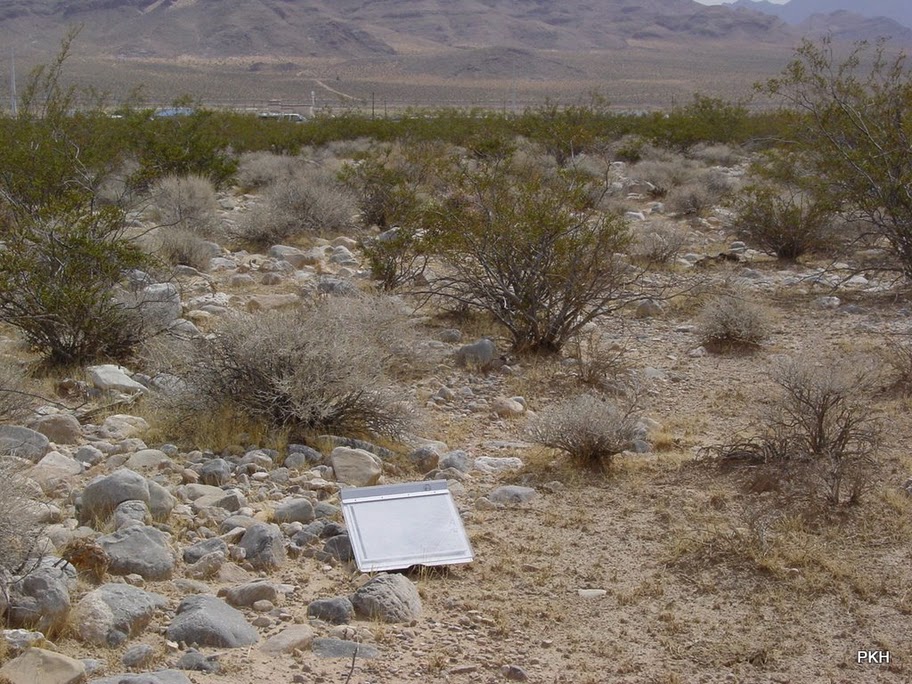
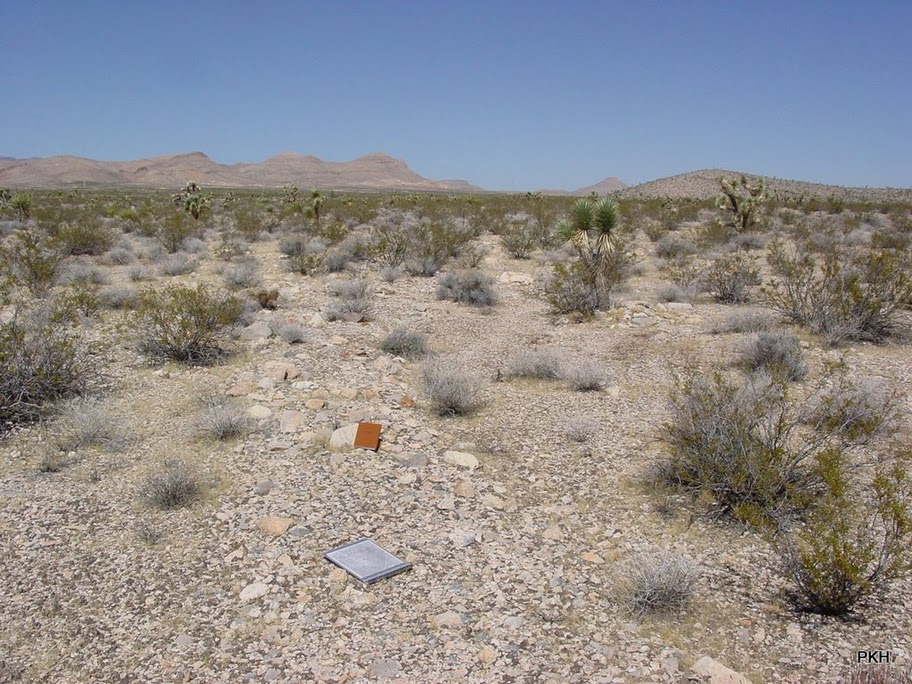
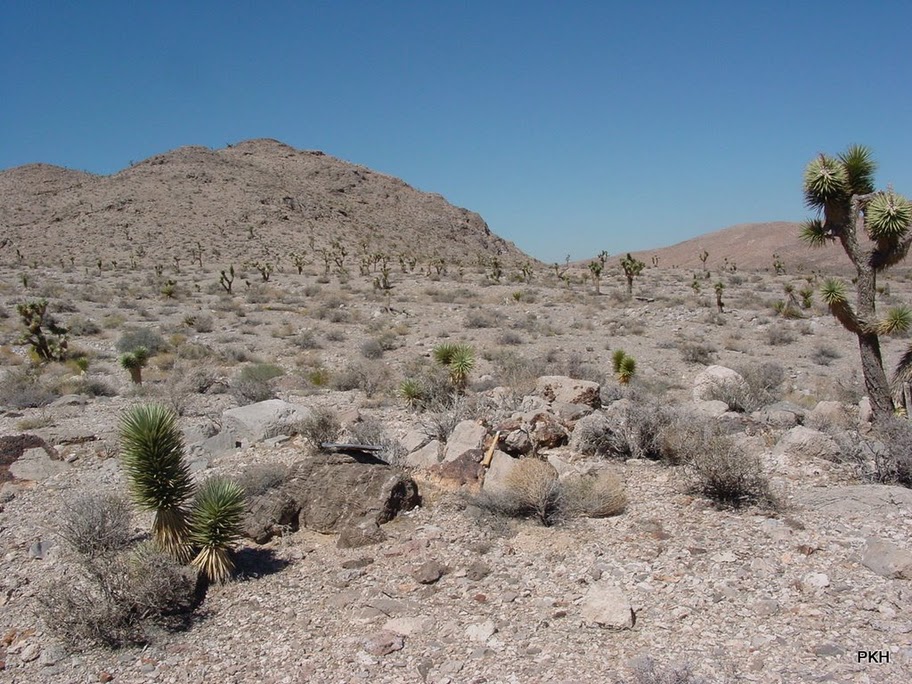
Figure 8. Series of 4 photos that illustrate the sequence of topographic leveling that occurs over time once active alluvial surfaces are abandoned. Top left: coarse gravel bar in active channel, unit Qay3; Bottom left: greatly subdued gravel bar crest on young abandoned surface, unit Qay2; Top right: older, but coarser gravel bar crest on older Qay2; Bottom right: Planar surface remnant with scattered protruding cobbles, unit Qay1.
Once a formerly active alluvial surface is abandoned, the first noticeable change is the transition to a progressively more muted surface topography characterized by “bar-and-swale” morphology. This is expressed as flattening of bar crests and channel bottoms and an overall reduction in relief between the two forms (fig. 8). Flattening occurs largely as a consequence of aeolian deposition (mainly of silt and fine sand), but local raveling, sheetwash, and surface-creep may also be factors. As time progresses, bar-and-swale topography becomes progressively more muted and the local relief between relict bar crests and swale troughs decreases until a nearly fully planar surface forms. In the case of particularly coarse-grained deposits, the planar form can be locally to extensively interrupted by protuberances of relict cobble and boulder bar crests.
Progressive flattening of depositional topography on abandoned alluvial surfaces in the Ivanpah Valley study area is due largely to the deposition of aeolian silt and fine sand. Major episodes of aeolian deposition probably coincide with major droughts and prolonged exposure of playa and distal alluvial fan surfaces to deflation by wind (Reheis et al., 1995; McFadden et al., 1998). The formation of gravel pavements is a characteristic phenomenon on desert piedmont alluvial surfaces (among other types) that occurs in conjunction with the deposition and translocation of fine-grained aeolian sediment (McFadden et al., 1987; Wells et al., 1995; Anderson et al., 2002). Incipient pavements develop locally in swales and on bar crests on alluvial surfaces that have been abandoned relatively recently, and over time pavements become more distinct with tightly interlocking surface clasts (fig. 10). Pavements do not form as readily (if at all) on surfaces where aeolian deposition is particularly active or involves more sand than silt. Surfaces in these areas do become distinctly planar, but are mantled with aeolian materials and may remain quite active areas of aeolian transport. In Ivanpah Valley, this condition is common along the east and northeast margins of playas.
Characteristics of Desert Soil Development and Surface Clast Weathering
Over time, inactive alluvial surfaces progress through a series of time-dependent physical and chemical changes related to physical weathering, chemical weathering, and translocation of surface materials to deposit interiors. These changes are expressed as surface clast weathering, stone pavement formation, and soil horizon development in the upper 1–2 m of the deposits (Birkeland, 1999). The type and magnitude of changes that occur are related to the duration of subaerial exposure; long-term absence of active fluvial processes; and environmental changes.
Soil Carbonate Development
The most useful changes for evaluating surface age in desert soils occur in the soil B-horizon and include development of soil color and discernible soil structure (Bw horizon); the accumulation of calcium carbonate (or other salt) (Bk or similar horizon), and accumulation of translocated clay (Bt horizon) (Bull, 1991). Soil carbonate development is typically the master criterion for establishing general surface ages on piedmonts in the western U.S. (e.g., Gile et al., 1966; Bachman and Machette, 1977; Machette, 1985).
We relied heavily on soil carbonate morphology in dividing surficial units by relative age in Ivanpah Valley. Carbonates and other soluble minerals (sulfates, halides, nitrates, etc.) are common components of soil profiles in arid and semi-arid regions because there is not sufficient water available to remove them. The elements necessary to form pedogenic carbonate (CaCO3) come from the following sources: CO2 is derived primarily through root respiration, water (H2O) enters the soil during precipitation (or through anthropogenic mechanisms), and Ca+2 ions are mostly derived from rain and dust (minor contributions can come from weathering of parent materials) (e.g. Gile et al., 1981; McFadden and Tinsley, 1985, McFadden et al., 1998; Naiman et al., 2000). When soil water becomes saturated with respect to calcium carbonate, it precipitates within the soil pore spaces. There is additional evidence that microorganisms can contribute to the formation of carbonate directly and/or indirectly (Monger et al., 1991; Lian et al., 2006).
Precipitation of pedogenic carbonate generally happens at specific depths that can be highly variable and are controlled by the depth of wetting. The depth of wetting is dependent upon many factors including effective precipitation and soil texture. Effective precipitation can vary with seasons and with climate changes (e.g., glacial vs. interglacial). Fine-textured soils have a greater porosity than coarse-textured soils, and thus have a shallower depth of wetting (Gile et al., 1981; McFadden and Tinsley, 1985). Depth of wetting can change through time if soil erosion or deposition occurs (e.g., aeolian sandsheets; or development of Av horizons). In addition, climate changes that result in increased effective precipitation can dissolve pedogenic carbonate and move it deeper or completely out of the soil. Most soils today with pedogenic carbonate are found under grassland or desert-type vegetation, but some exist under pinyon-juniper woodland where the present soil-moisture conditions differ from those that existed when carbonate was accumulating in the soil (Machette, 1985). Increased rainfall associated with climatic gradients near mountain ranges has a profound effect on the distribution and concentration of pedogenic carbonate (Gile et al., 1981).
The accumulation of pedogenic carbonate in the soil profile has been closely linked to soil age (Gile et al., 1981; Machette, 1985). Soils on progressively older geomorphic surfaces contain progressively greater amounts of pedogenic carbonate. In addition, with increasing time, the carbonate forms specific morphologies that have been defined as Stages I through VI (Gile et al., 1981; Bachman and Machette, 1977) (fig. 9).
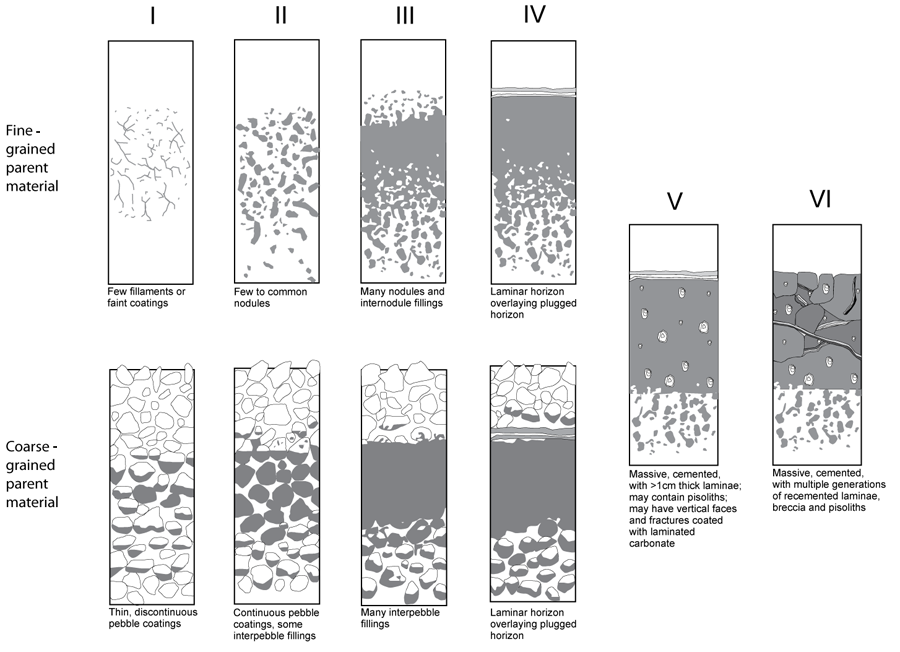
Figure 9. Illustration of time-dependent changes in soil carbonate horizon morphology in gravelly soils. Modified with permission from a figure provided by Amy Brock, Univ. Tennessee.
The definitions of these stages vary between fine-textured (sand and finer) and coarse-textured (gravelly) soils (Gile et al., 1966; Gile et al. 1981). The time required for a soil to develop the different stages of carbonate accumulation is dependent upon the soil’s texture, because texture controls soil porosity (volume of pore space). A fine-grained soil contains has greater porosity and requires a correspondingly greater amount of carbonate to fill the pores and form greater stages of carbonate accumulation as compared to a coarse-textured soil (Gile et al., 1981). This generally means that it takes more time for a fine-grained soil to reach the same stage of carbonate morphology as a coarse-textured soil in the same area. Recent research has shown that changes in soil texture strongly affect hydrologic conductivity such that the rates of carbonate accumulation may vary greatly even locally (Treadwell-Steitz and McFadden, 2000). Additionally, soils that contain carbonate parent materials appear to form calcic and petrocalcic horizons faster than soils with non-carbonate parent materials (Machette, 1985; Reheis et al., 1992; Treadwell-Steitz and McFadden, 2000). This is a factor in soil formation on the northwest and west sides of Ivanpah Valley where carbonate bedrock is extensively exposed.
In soils with stage III or greater carbonate development, a marked and progressive volumetric expansion occurs as pedogenic carbonate continues to precipitate. This results in the original detrital grains floating in a matrix of pedogenic carbonate, and a volumetric expansion of 400 to 700% from the original framework (Bachman and Machette, 1977; Machette, 1985). Stage V and VI horizons have so much CaCO3—commonly more than 50% in gravelly materials and more than 75% in fine-grained materials—that the texture of the parent material is completely obscured in these horizons. In carbonate stage III or greater, pressure solution (force of crystallization) of parent material clasts adds Si, Mg, Al, and other ions which results in the precipitation of sepiolite and palygorskite clay, and opal (Bachman & Machette, 1977; Watts, 1978; Hay and Wiggins 1980; Watts 1980; Reheis, 1988; Monger and Daugherty, 1991a,b; Monger and Kelly, 2002; Brock, 2007; Robins et al., 2008). These processes also operate inside stage II pendants (Brock and Buck, 2005).
The carbonate morphology (stages) and the rate at which carbonate accumulates in soils are dependent upon:
- Amount of effective precipitation
- Amount of Ca+2 ion input (dust/rain)
- Time (landscape stability, erosion/sedimentation)
- Presence or absence of carbonate minerals in parent material (or in dust)
- Soil texture
- Presence of vegetation (must have respiration for carbonate to form in soils) (see Rech et al., 2003; Amit et al., 2006).
- Microbial precipitation of carbonate (?) (e.g. Monger et al., 1991; Lian et al., 2006)
In most regions within the desert Southwest, the stage of soil carbonate morphology is a useful indicator of the relative age of a geomorphic surface. Previous studies have attempted to measure rates of soil development using soil carbonate, but as is often the case for Quaternary research, the lack of numerical dates has limited this technique. McFadden and Tinsley (1985) modeled the rate and depth of carbonate accumulation with variable temperature and precipitation values and found that these variables can strongly affect pedogenic carbonate formation. Machette (1985) compared the stage of carbonate development with time for eight different geographic regions and demonstrated how the stages of carbonate morphology are strongly controlled by the amount of effective precipitation and dust (Ca+2) input through time. He found that for Holocene and latest Pleistocene calcic soils (i.e. those that formed during an interglacial climate), average accumulation rates are, in most cases, almost twice as high as compared to older soils (i.e., those that formed during glacial climates). Harden et al. (1991) found that geographical variation in the soil development rates varies by a factor of 2 to 3, whereas the temporal variation between the Holocene versus the Pleistocene may be as much as a factor of 10 or more. Therefore, when using carbonate morphology as a relative age indicator, one must be careful to compare sites with similar climate histories. McFadden (1988) examined soil characteristics versus age for soils in the Mojave Desert. He found that latest Holocene soils aged 100–2000 yr B.P.(B.P.=before present) have no carbonate; late Holocene soils aged 2–4 ka (ka=thousand years ago) have stage I; middle Holocene soils aged 4–8 ka have strong stage I to stage II carbonate; early Holocene to latest Pleistocene soils aged 8–13 ka have stage II carbonate; late Pleistocene soils aged 20–70 ka have strong stage II to incipient stage III carbonate; late Pleistocene to late middle Pleistocene soils aged 70–200 ka have stage III carbonate; and middle Pleistocene soils aged 300–700 ka have strong stage III carbonate morphology (e.g., fig. 10). It is generally the case that soils on older to ancient surfaces (early Pleistocene to Pliocene) develop progressively stronger, massively indurated carbonate horizons (stages IV, V, and VI) if they are isolated from erosion and if climate change has not been sufficiently humid enough to significantly dissolve previous carbonate accumulation. Such ancient soils are common in the Ivanpah Valley study area (e.g., fig. 11 and fig. 12).
Calcic soils can be confused with non-pedogenic accumulations of carbonate (Machette, 1985), including: groundwater carbonates, lacustrine carbonates and/or marine limestones, and hot or cold spring-deposited carbonates (e.g. Machette, 1985; Monger and Adams, 1996). Water concentrated in arroyos can preferentially focus accumulation of carbonate beneath the channel surfaces (Amit et al., 2007). Amit et al. (2007) termed these deposits “Fluvial Pedogenic Units” (FPU). Care must be taken to distinguish FPUs developed in channels from pedogenic calcic soils developed across an entire landform. Additionally, surface runoff, especially over exhumed petrocalcic horizons that have low/no permeability along bottoms of arroyos, can quickly precipitate CaCO3 and produce laminar zones that can resemble pedogenic carbonate of stage IV and V morphology. Care must be taken when examining carbonate along bottoms of arroyos or exposure faces where runoff occurs. This (usually very white, sometimes soft) carbonate is part of a process called case hardening. Significant errors can occur when these features are misinterpreted as morphologic stages. Distinctive characteristics of groundwater carbonates include larger crystalline sizes (spar carbonate as compared to micrite in pedogenic carbonate), grain-to-grain contacts (as compared to pedogenic carbonate that is matrix supported), and a lack of horizonation and morphologic structures (i.e. pisoliths, pendants, calcified roots in pedogenic carbonates) (Machette, 1985).
Evidence for lacustrine or marine environments can be distinguished from pedogenic carbonates by the presence of fossils, and surrounding depositional facies. Hot or cold spring carbonate deposits are often similar to those of groundwater carbonates. In addition, spring deposits tend to be local in their distribution (unlike soil carbonates), and fossil evidence may indicate ponded water.
Desert Pavement Development
The development of stone pavements on abandoned alluvial surfaces is a time-dependent process that is intimately linked with desert soil formation processes (Cooke, 1970; Wells et al., 1985; McFadden et al., 1986; McFadden et al., 1987; Al-Ferraj and Harvey, 2000; Quade, 2001; Anderson et al., 2002; Wood et al., 2005; Valentine and Harrington, 2006; Pelletier et al., 2007; Al-Farraj, 2008; Dixon, 2009; Matmon et al., 2009). Desert, or stone, pavements are inflationary, commonly single-grain, organized layers of gravel that are separated from the original depositional surface by a gravel-free layer of silt. They form as fine aeolian sediment is deposited and translocated downward into surface clast interstices and deposit pore spaces forming a soil Av horizon (McFadden et al., 1998; Anderson et al., 2002). The pavement layer is generally one to two grains thick and overlies a layer of aeolian silt with little or no gravel, which in turn overlies the gravelly parent material (Wells et al., 1985; McFadden et al., 1987). Well-developed desert pavements are remarkable for tight, mosaic-like clast interlocking and overall low roughness. Over time, desert pavements get progressively tighter and more intricately interlocked. As surface pavements age, they also incorporate weathered fragments of parent gravels, and fragments of soil carbonate. The darkness, luster, and continuity of rock varnish also generally increases with increasing age (often best expressed on clasts from silica-rich parent materials). It is critical to note, however, that there is a point in time beyond which desert pavements do not remain stable and well-organized. As paved landforms become progressively older, more deeply dissected, and subject to climatic changes, the pavement can become disrupted or destroyed in a cycle of potentially repeating reformation. This can result in retrograde pavements that incorporate clasts of older, degraded carbonate soils and may even form on relatively steep slopes.
 |
 |
 |
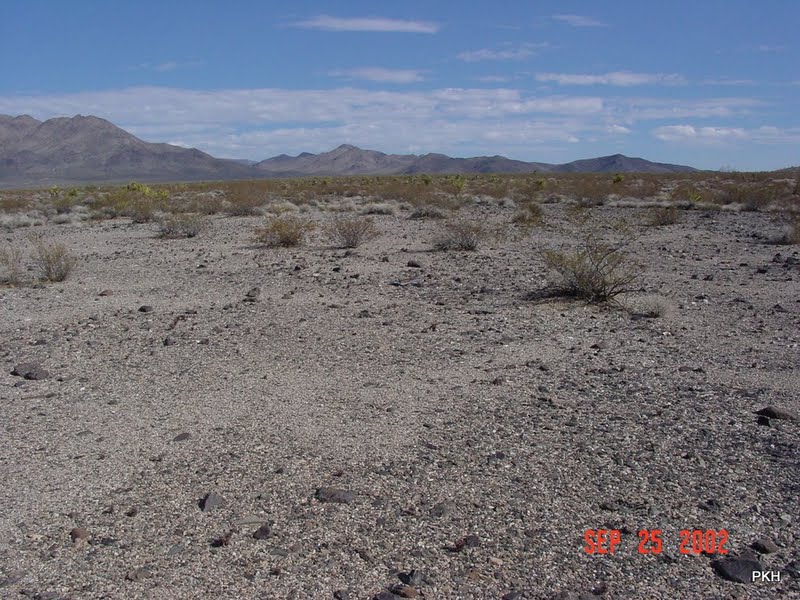 |

|
|
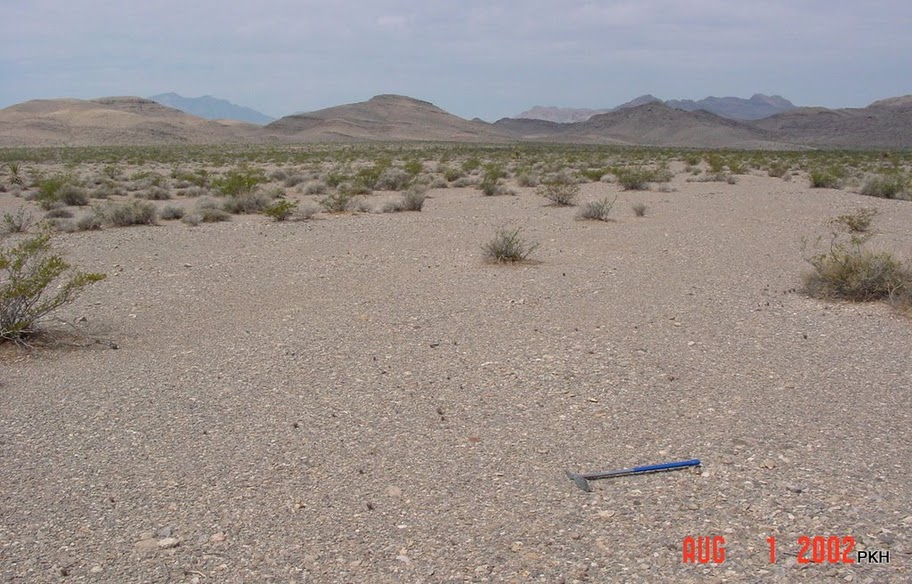
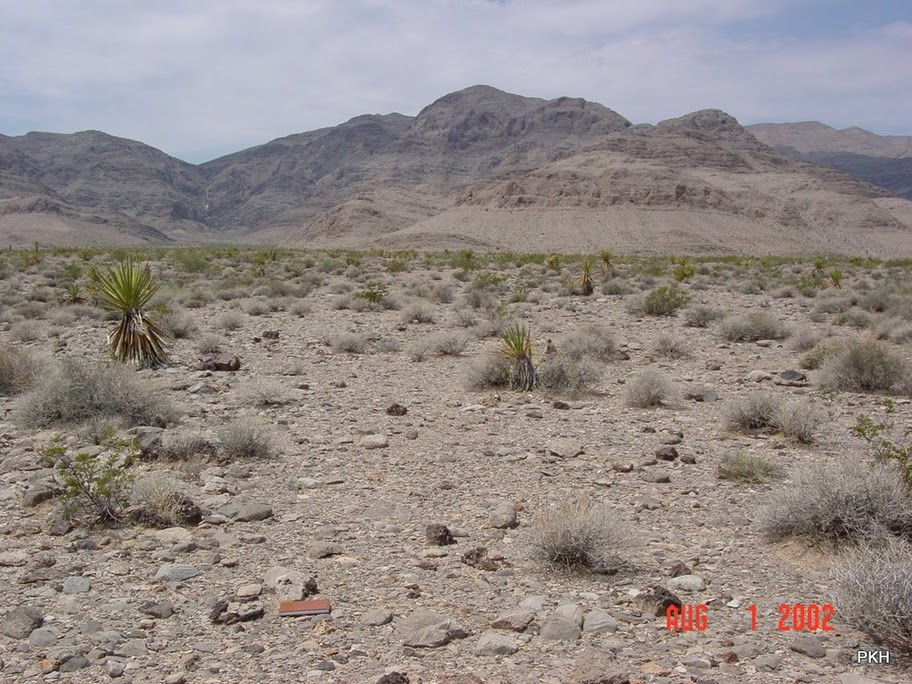
Figure 14. Examples of planar morphology and desert pavement patterns typical of unit Qay1 and Qai. Note moderately strong desert pavement development in each example and slightly protruding gravel bar crests in lower image. Top: Qay; Middle: Qai; Bottom: Qay1.
The processes that form planar surfaces, desert pavements, and rock varnish are polycyclic. As climate varies between wet and dry, abandoned alluvial surfaces progress through similar subaerial processes in each interval. This can include a cycle of pavement formation, aeolian deposition, and soil calcic horizon development that is interrupted by a moist climate regime that leaches materials deeper into the soil and may also be associated with an increase in vegetation density. The once stable surface may be disrupted by the growth and death of multiple generations of vegetation (e.g. Quade, 2001). If the cycle begins again, the disrupted surface will be subjected to a new round of aeolian deposition and pavement formation. In this instance the pavement may include clasts derived from the previously stable soil.
Surface Clast Weathering
Long-term subaerial exposure of abandoned alluvial surfaces can promote the physical weathering of surface clasts by processes of dissolution, disintegration, cracking, and spalling. Prolonged exposure and solar radiation also results in the development of rock varnish on surface gravels, formation of carbonate collars on surface clasts, and reddening of surface clast undersides (Mcfadden et al., 1998; McFadden et al., 2005). Degrees of surface clast weathering and staining by desert varnish are useful map criteria.
In desert areas, dissolution features are common on surface gravels from carbonate source rocks or with carbonate cement. In the Ivanpah Valley area, the most common dissolution forms are pitting and etching of limestone clasts. These clasts have very rough textures, prominent rough-textured micro-karst features, and are often characterized by protruding chert nodules, lenses, and laminae that are not subject to dissolution (fig. 14). The relative depth of etching and the relative relief of resistant inclusions increase with increasing surface age. Some sandstone clasts in the study area exhibit a solution-weathering pattern with a honeycomb texture that resembles raindrop impacts (fig. 15). Clast disintegration is most common in granitic rocks in the study area and may be related to salt-weathering and mineral decomposition. Clast cracking and spalling is characteristic of all rock types in the area to varying extents and may reflect responses to thermal stresses induced by prolonged, diurnal phases of solar heating (McFadden et al., 2005).
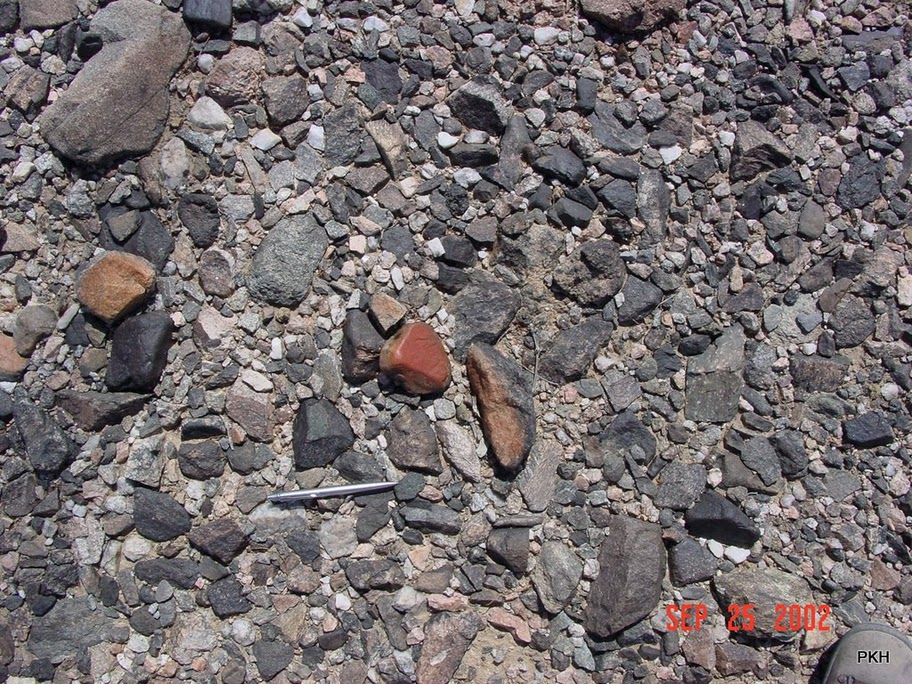
Dark staining of surface clasts by the development of rock varnish on exposed surfaces and reddening of clast undersides is a characteristic feature of stable geomorphic surfaces in arid landscapes (fig. 16). Rock, or desert, varnish is a dark, manganese-rich coating that commonly forms on silicic clasts on stable desert landforms and bedrock surfaces. It apparently forms through a complex organo-chemical process that involves dissolution of silica and concurrent incorporation of microbial components (Perry et al., 2006). The extent, darkness, and sheen of desert varnish all have some degree of time-dependence. In the Ivanpah Valley area, weak and discontinuous varnish is evident on relatively young, inactive surfaces, typically on the crest of gravel bars in areas of bar and swale topography; however, varnish is much more distinct and more strongly developed on planar surfaces associated with Pleistocene deposits (fig. 17).
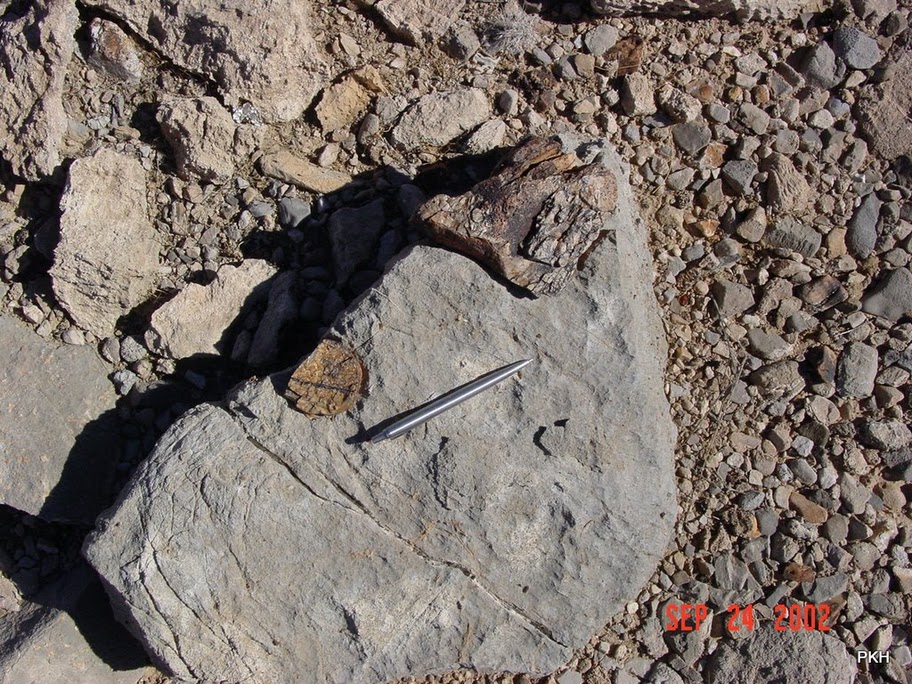 |
 |
Figure 15. Deeply weathered limestone boulders on Qai surface. Darker, protruding areas are chert lenses and nodules that are not susceptible to chemical dissolution; Unit Qai.
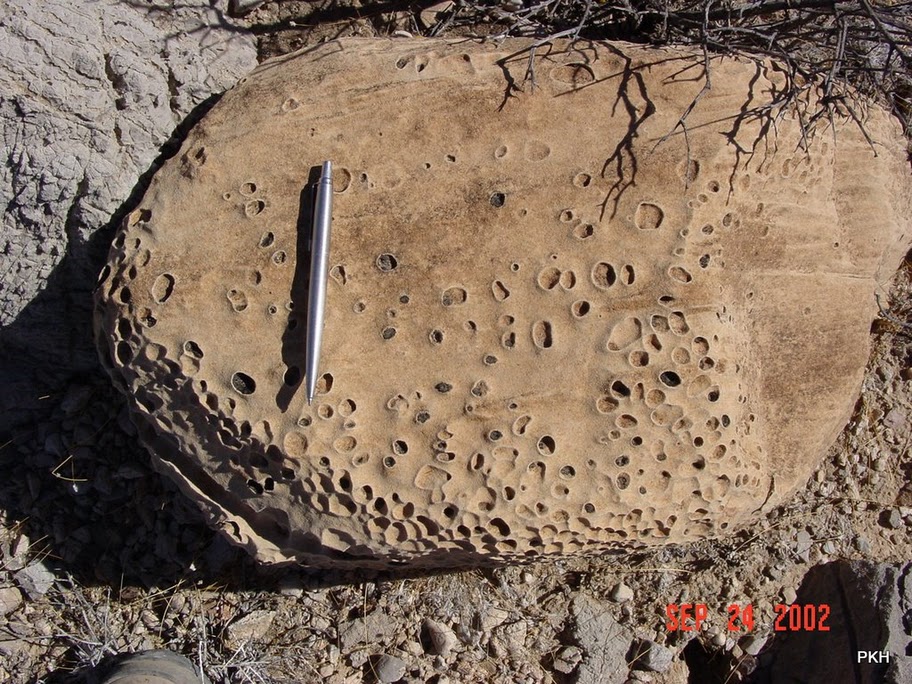 |
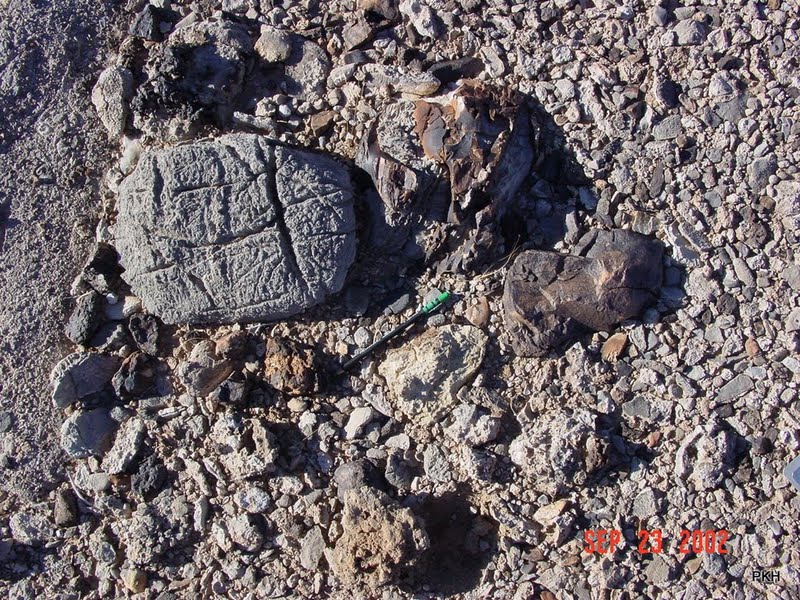 |
Figure 16. Dissolution pits on large sandstone cobble (upper) and etched furrows on limestone clast (lower). Both examples from Qai surface.
 |
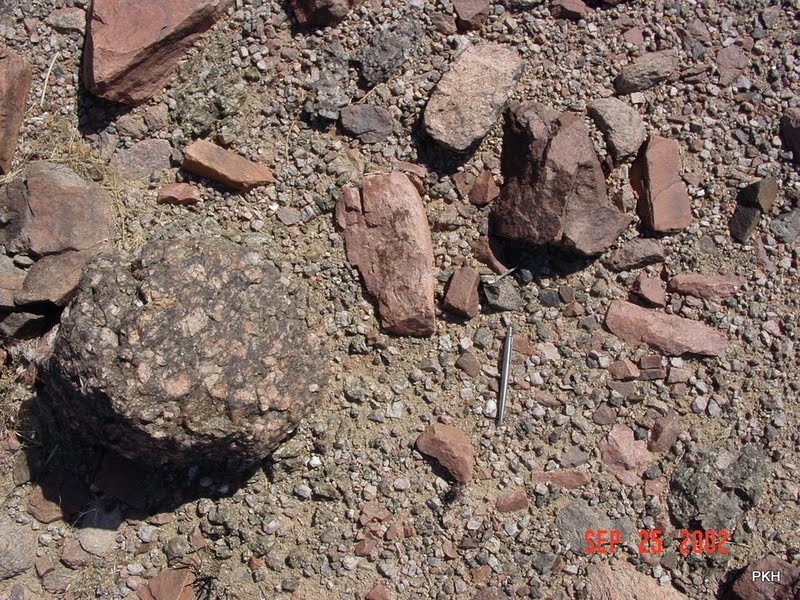 |
Figure 17. Top: Moderately to darkly varnished granitic gneiss surface clasts in tight desert pavement on unit Qai, Lucy Gray fan. Overturned clast shows strongly reddened bottom surface. Lithology includes volcanics and granitic gneiss. Bottom: Example of split rock fragments on Qai surface. Predominantly granitic gneiss.
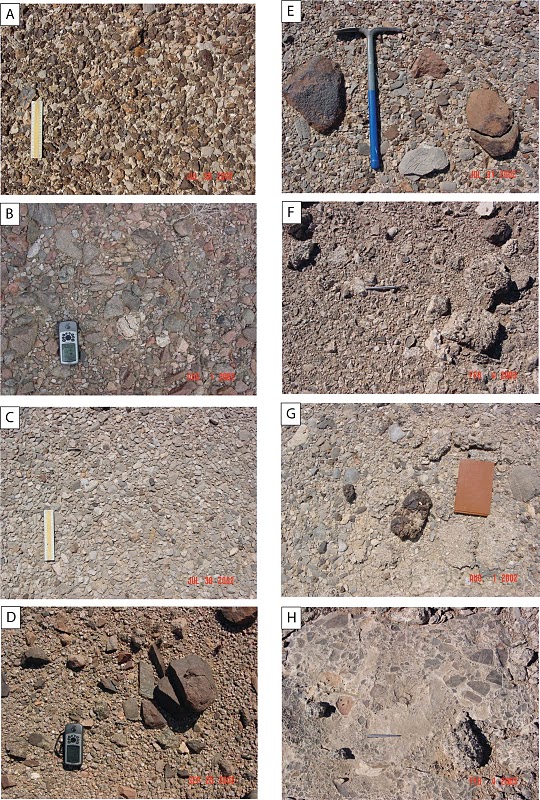
Figure 18. Variability in desert pavements in the study area. A: Qay1 surface with abundant varnished chert and sandstone gravel; B. Qay; C. Qay1; D. Qay1; E. Qai; F. QTa surface with fragments of petrocalcic horizon; G. older Qai surface with calcic pendants and petrocalcic fragments; H. QTa/Tay with exposed petrocalcic horizon.
Descriptions and Examples of Ivanpah Valley Map Units (House et al., 2006)
The principal surficial map units in the study area include three general bedrock types, and various deposits composed of alluvial, colluvial, aeolian, and playa sediments. Some units include combinations of these sediment types. Alluvial deposits constitute the majority of surficial map units in the valley (Table 2. Areal extents and relative percentages of all geologic map units in study area). The following descriptions are slightly expanded from those in House et al. (2006).
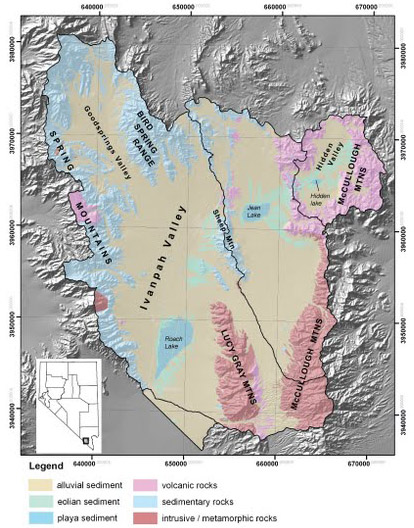
Figure 19. Simplified geologic map of the study area showing the distribution of general surficial units and bedrock types. Basin boundaries are indicated. UTM grid (NAD 83) shown with 10 km spacing.
Statement on Nomenclature
We used a conventional alphanumeric nomenclature for the surficial geologic map units in the Ivanpah Valley area (House et al., 2006). The labels range in length from 2 to 5 characters. The first character represents the geologic period to which the deposit dates: Q, Quaternary; T, Tertiary, Mz, Mesozoic, Pz, Paleozoic; YX, Proterozoic. Combinations of two of these modifiers (listed from youngest to oldest) represent either uncertainty in the age of the deposit (e.g. QT) or intentional generalization of two or more units into one (e.g., MzPzs). The second character in the label indicates the type of deposit: a, alluvium; p, playa sediment; e, aeolian (windblown) sediment; c, colluvial sediment; x, disturbed area. The third character is either a relative age indicator for alluvial deposits (y: young; i: intermediate; and o: old) or a modifier to the previous character indicating a specific context; the latter case was applied in only three instances: Qea, which is a mixed deposit of alluvium overlain by a veneer of aeolian sand; Qcf, which is a composite of colluvium and alluvium that often has a steep fan-like morphology; and Tek, which is an extremely strongly developed, ancient carbonate soil formed in aeolian sediment. Some related unit labels include a fourth, numeric identifier. When a number is present within a suite of related units, it represents their relative depositional order. In other words, the deposit that came earlier has a lower number.
Numbering map units in relation to the order of their deposition is a standard convention in geological mapping, but it is occasionally reversed in surficial mapping efforts. This can lead to confusion. The rationale for a reverse numbering system often appeals to the reasoning that the youngest unit is the easiest to identify and is thus the basis for beginning the numbering sequence. However, this logic is underpinned by an implicit assumption that the resulting map will represent a single point in time (e.g., the date of the most recent base materials used in the mapping or the date of the field work; or, more likely, a combination of each). However, if a surficial geologic map is compiled with the possibility of revision in mind, a numbering scheme based on depositional sequence is arguably a better approach. For example, if there is a significant flooding event in a given area that results in notable and mappable amounts of erosion and deposition, the resulting “new” deposits would be more easily incorporated into a mapping scheme that is based on depositional order. Thus, one school of thought reflects a concern for the possibility of subsequent recognition of older deposits unidentified in the original mapping effort; whereas the scheme used in these maps reflects a concern for accommodating inevitable changes in the future.
Each unit is described below. The descriptions are based on those in House et al., (2006) but are somewhat extended. Each unit type is accompanied by a photograph of a representative example of the unit in the field area.
Anthropogenic Features and Deposits
The study area currently has only minor amounts of anthropogenic disturbance. Some of the features are locally significant, for example: Interstate Highway 15; casino complexes in Jean and Primm, the town of Goodpsrings; various power stations; gravel pits; and miscellaneous cultural features. These features may have important local consequences on runoff amounts and patterns, but overall, the amount of anthropogenic modification in Ivanpah Valley is presently quite small. Significantly expanded development is likely in the future.
Qx Disturbed and modified areas

Figure 21. View looking ESE across the study area toward Sheep Mountain (foreground) and the McCullough Range (background). Hotel-casino structures typical of unit Qx in the valley are evident.
This unit includes areas of extensive anthropogenic disturbance, including: commercial development (hotel casinos, apartments, shopping malls, parking lots, power plants, and similar features, mainly in the areas of Jean and Primm), town sites (Goodsprings), mining operations (quarry and aggregate) and borrow pits, and major transportation corridors (Interstate Highway 15, Union Pacific Railroad). Areas mapped as Qx are either too disrupted or obscured to map them as the original geological deposit.
Playa and Related Deposits
The Ivanpah Valley study area is entirely internally drained. All runoff in the watershed drains to one of four dry lakes (playas): Roach Lake, Jean Lake, Hidden lake (informal name), and Ivanpah Lake. The latter lies almost entirely in California and may receive intermittent runoff from a small part of the map area. The extremely small part of Ivanpah Playa that lies in Nevada is covered by pavement and a casino/shopping mall in Primm, Nevada (unit Qx). The flat playa surfaces are often fringed by a zone of mixed playa, aeolian, and alluvial deposits that mark the transition between the fan-dominated piedmont and the playa. The concentration of aeolian sediment is highest along the north and northeast edges of the playas.
Qp Playa deposits (latest to late Holocene)
Playa surfaces in the study area are exceptionally conspicuous features characterized by very light tone, flatness, and location in valley bottoms. They consist of flat-lying deposits of light-gray to tan silt, clay, and minor sand. Fine-grained playa deposits are interfingered with and locally overlain by pebble-cobble gravel and sand along marginal interface with active, distal alluvial surfaces. Morphologically, playas are conspicously planar and flat, with some long wave-length, low-amplitude undulations. Local topography associated with gilgai features include small (few meters) depressions and mounds. Some areas have extensive mudcracks and large desiccation cracks present locally (Neal et al., 1968). Aeolian features are present on some parts of the playas in the form of low linear dunes and discontinuous sand sheets, which are rarely within the main perimeter of the playa landform. Each playa in the study area is characterized by abundant aeolian deposits along their downwind margins (predominantly the north-northeast margins). These aeolian deposits comprise the playa fringe unit on the map.
The soils on these active playa surfaces are characterized by A-Bw-Bk horizons composed of clay loam, and stage I or II carbonate morphology. These areas are active sites of deposition and are inundated frequently with shallow, standing water. Older playa sediments or shoreline features were not found at the surface in the study area.
Qpf Playa fringe deposits (latest Holocene to latest Pleistocene)

Figure 24. Roach Playa fringe. This photo, looking north toward the Bird Spring Range, shows mudcracked silt from recent piedmont runoff onto the playa surface. Darker toned area just beyond the truck is veneer of gravel related to the same runoff event. Light band of vegetation beyond the playa edge marks zone of predominantly aeolian deposits.
The playa fringe unit includes deposits of silt, sand, and gravel along the perimeter of playa surfaces. This unit is comprised of an intricate mixture of aeolian, fluvial, and playa sediments. each of which varies in relative proportion depending on local conditions. and geographic position relative to the playa and prevailing wind directions; aeolian and fluvial sediments are dominant surficial constituents in the map unit. Locally, this unit grades into Qea, Qe, or Qay, and may include some Qay1. The playa fringe unit is interpreted to represent playa-bajada interface with locally significant aeolian component, particularly along the east and northeast boundaries of playa surfaces. On aerial and remotely sensed imagery, the playa fringe areas are characterized by irregular and diffuse, light-to medium-toned pattern.
Soils on Qpf surfaces are generally characterized by thin (4–15 cm) A horizons composed of loamy sand or sandy loam, that usually overlie a C horizon or a series of horizons belonging to a buried soil. Rarely, a Bk (15 cm thick) horizon containing stage I carbonate morphology can occur beneath the surficial A horizon.
Aeolian Deposits and Related Deposits
Aeolian deposits in Ivanpah Valley consist of unconsolidated deposits of wind-blown sand in the form of sheets, dunes, and ramps. The distribution of aeolian deposits defines a north-northeast trend through the study area that coincides with the distribution of playas. The playas themselves and deposits along the distal ends of alluvial fans are the presumed source of the sand. Thickest deposits of aeolian sand occur upslope of the north-northeast margins of playas. Several aeolian “passes” are present in the study area where the long-term sand transport trend encounters steep, bedrock topography. Most striking among these include parts of the Sheep Mountain and “little” Sheep Mountain areas, the prominent volcanic cliffs to the NE of Jean Lake, and the similar cliffs to the NE of Hidden lake. Correspondingly, much of the western piedmont of Sheep Mountain, the eastern side of Jean Valley, and all but the NW part of Hidden Valley have significant accumulations of aeolian sand.
Overall, the map pattern of aeolian deposits suggests a “causeway” of aeolian transport extending from Ivanpah Lake (just beyond the southern margin of the study area) to the steep bedrock slopes that form the eastern margin of Hidden Valley.
Qe Aeolian sand (latest Holocene to late Pleistocene)
This map unit includes unconsolidated deposits of windblown sand and minor silt. Light tan to light yellow color. Very light tone on aerial imagery. Unit generally corresponds to areas with at least 1 m thick mantles of aeolian sand. Morphology ranges from flat-lying to broadly undular sheets of sand on inactive or rarely active alluvial fan surfaces, sand ramps and falling dunes on steep bedrock slopes (best expressed in the Sheep Mountain and Hidden Valley areas), and small areas of active dunes. These aeolian deposits are relatively easy to discern on remotely sensed imagery because they are relatively light in tone and have a generally smooth appearance. The latter characteristic is particularly pronounced in places where aeolian deposits onlap irregular bedrock exposures and paved and varnished abandoned alluvial fan surfaces.
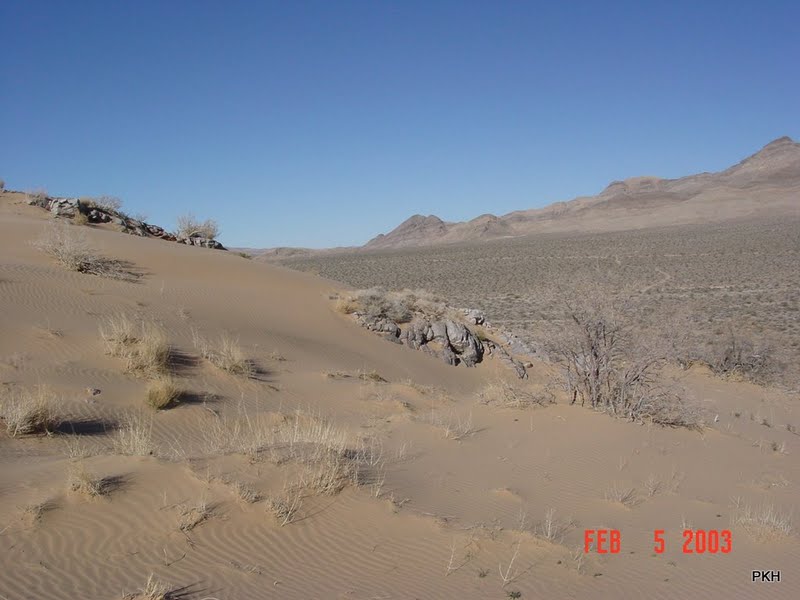
Figure 25. Fresh aeolian sand on crest of small bedrock ridge NE of Roach Playa. View toward Sheep Mountain. Note fresh ripples in sand deposit. Many bedrock outcrops in this area show clear evidence of wind-abrasion.

Figure 26. Thick aeolian deposits in the form of “sand ramps” on the west-facing slopes of a ridge of the McCullough Mountains that encloses Hidden Valley along its western edge.
Soils on Qe surfaces are commonly characterized by A or C horizons overlying B or Bk horizons of variable thickness that most commonly contain little/no carbonate. With increased depth, Bk horizons may contain stage I filaments and, in places, stage II nodules.
Qea Mixed aeolian sand and alluvium (early Holocene to middle Holocene)
This map unit is predominantly comprised of sand “sheets” or really extensive veneers of aeolian sand that range up to approximately 1.0 m thick. and mantle inactive alluvial fan surfaces (mainly Qay1 and Qai surfaces in this case, although older surfaces are commonly mantled with Qe). These deposits commonly mantle inactive to infrequently active alluvial surfaces located between playa surfaces and areas of active dunes or ramps on hillslopes.
The Qea surfaces are distinct from the Qe surfaces in most cases, although their boundaries are gradational. In particular, Qea surfaces host a distinctly higher vegetation density, and are commonly mantled with a thin (~single-grain) veneer of subangular fluvial gravel. Where present on unit Qea, the surface gravel lag is commonly separated from the underlying alluvial gravel by up to 1 m of aeolian sand with dispersed, sparse pebbles. The surface gravel lag is generally loose and dispersed but grades upfan/upslope into moderate to strongly developed gravel pavements in some locations. The loose gravel lag may be an inflationary veneer or thin alluvial veneer, or both. Landscape position of this unit suggests that it represents burial of Qay1 surfaces by a significant early to early-middle Holocene episode of aeolian deposition (e.g., McDonald et al., 2003). Unit Qea is more extensive than mapped, but is only divided in areas where aeolian sand component is strongly evident in remote imagery and where field examination indicates thickness of aeolian mantle in excess of 75 cm. Soils on Qea surfaces are very similar to those associated with Qe surfaces.
Tek Ancient petrocalcic soil remnants (Pliocene to late Miocene)
This map unit includes a small number of exposures of of relatively flat-lying, massively indurated layers of soil carbonate on bedrock surfaces. This conspicuous deposit was first recognized and mapped as a separate unit by Kohl (1978). The Tek surfaces that were identified in central Ivanpah Valley are characterized by variably eroded (i.e., from deeply etched to brecciated), thick stage VI petrocalcic horizons developed in deposits of aeolian sand and silt overlying bedrock. During our investigation, we identified Tek-like surfaces overlying alluvial gravels in parts of the Bird Spring Range.
The highest concentration of Tek outcrops in the study area corresponds to zones of persistent and long term flux of aeolian sediment, mainly in and around the perimeter of Hidden Valley and the hills northeast of Jean (the Jean “hills”). Tek also caps relatively flat-lying volcanic rocks in the hills that flank the west side of Hidden Valley. These massive petrocalcic horizons are characterized by intervals of multiple cross-cutting laminae that can be up to 12 cm thick, pisoliths (often vertically elongated), and ooids. Where present, one or more of the following horizons may overlie the stage VI petrocalcic horizon: C (recent aeolian sediment of variable thickness), Av (4+ cm thick), and Bk (31+ cm thick) containing stage I, II, or incipient III carbonate morphology. In best exposures, Tek petrocalcic horizons are up to 4–5 m thick. Tek surfaces express a very light tone on aerial imagery.
Hillslope Deposits
In the study area, mapped hillslope deposits include weakly to strongly consolidated deposits of angular and subangular gravel on steep bedrock hillslopes. Locally may include disaggregated mantles of weathered bedrock, but is more commonly associated with gravity-driven accumulations of coarse gravelly talus below steep bedrock cliffs and gravels forming small, steeply sloping debris fans. In many cases, the latter type exhibits morphology and sorting consistent with debris flow processes. These deposits were not mapped to the level of detail applied to alluvial and aeolian deposits and they are certainly more extensive than shown on the map.
Qc Colluvium (latest Holocene to Pleistocene)
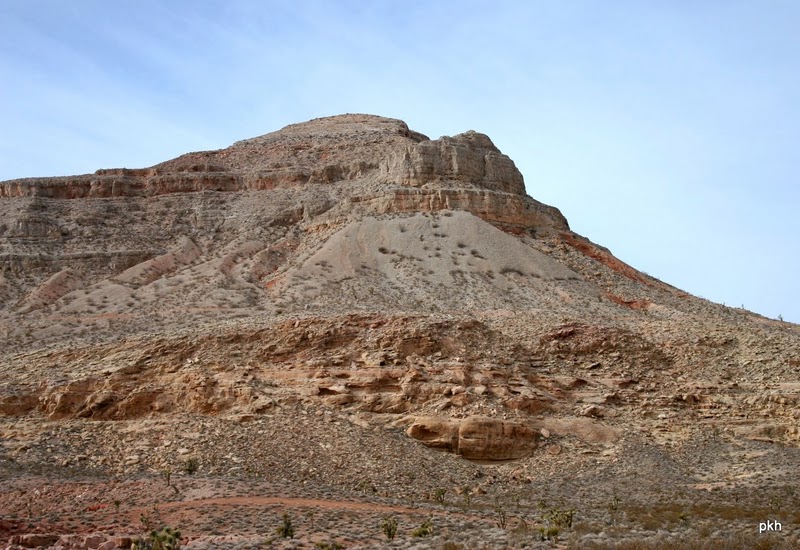
Figure 29. Unit Qc is most common in areas of cliff-forming sedimentary rocks in the field area. This photo is from near the Bird Spring area.
This is an undivided map unit comprised of coarse, poorly sorted deposits of angular and subangular boulder-to pebble-gravel on steep bedrock slopes. It is particularly common in small mountain-front embayments and below steep bedrock cliffs. Colluvial deposits may include irregular mantles of weathered and disaggregated rock on steep bedrock slopes, small debris cones/alluvial fans in small drainages, and areas of thick accumulations of angular gravel (talus) below steep bedrock cliffs. Overall, this unit was mapped sparingly with emphasis only on the most extensive deposits and those easiest to discern on aerial imagery. It is expected that colluvial deposits are very extensive in the mountains in the map area, but are impractical to map in detail. Unit age varies widely from Recent to early(?) Pleistocene. Surface clasts vary from weakly to very strongly varnished, pavements rarely present, soil calcic horizon development varies from minimal to strongly developed stage III to IV.
Qcf Colluvium and debris fans (latest Holocene to Pleistocene)
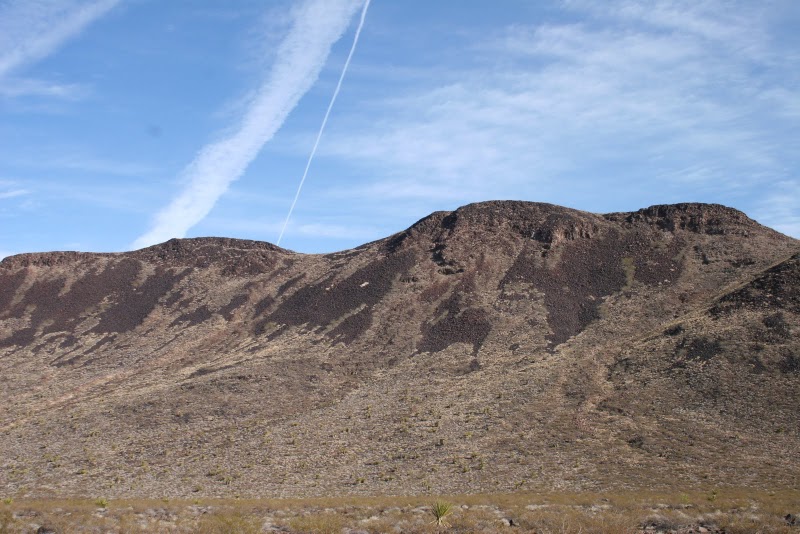
Figure 30. Typical expression of unit Qcf as mapped in the study area in the Northern McCullough Mtn area. The map unit is commonly a mix of talus, colluvium, and small bouldery debris fans.
This is a mixed map unit comprised of coarse gravel deposits of slope wash, debris fans, and minor talus on steep bedrock slopes. The “f” in the designation indicates that the unit includes small, steep, alluvial fan or debris fan deposits composed of angular to subangular boulders and cobbles. These are particularly common on steep bedrock slopes formed in mafic volcanic rocks in the northeast part (i.e., Hidden Valley) of the study area. The surface morphology of this unit is variable, but generally rugged or irregular. It can be characterized by block fields, debris cones, small debris fans, or debris flow levee complexes. Unit age probably varies widely as well. Surface clasts are weakly to very strongly varnished, pavements are rare, soil calcic horizon development varies from minimal to strongly developed stage III to IV.
Alluvial Deposits
The most extensive class of surficial deposits in the study area is comprised of active and relict alluvial fan and ephemeral wash surfaces and their related sedimentary deposits. Alluvial deposits make up over 50% of the map area. Washes include alluvial fan feeder channels, well-defined axial streams, and channels in stable distributary flow networks. Alluvial fans include extensive areas of downstream branching, unstable distributary flow networks, broad areas that convey relatively shallow swaths of unconfined flows, and areas of intricately braided washes. In many cases, active washes and fans are intricately interrelated or gradational, so no effort has been made to separate them on the map.
Collectively, these features have been formed, intermittently occupied, and abandoned by active fluvial processes for approximately the last 4 to 5 million years. However, most of the deposits date to the Quaternary Period, which spans the last 2.6 million years. The majority of ancient and recent alluvial deposits examined in the field were deposited by streamflow processes. Deposits related to debris flow processes were observed in some areas (described below) but are far less common and rarely extend much below the mountain fronts. Alluvial fan and wash deposits form the bulk of the piedmont areas below mountains and hills in the study area. Correspondingly, clast compositions of the alluvial deposits reflect the primary source lithologies as follows: Spring Mountains (predominantly Mesozoic and Paleozoic carbonate and siliciclastic rocks with minor volcanic and intrusive rocks below Table Mountain and Devils Peak, respectively), the Bird Spring Range (predominantly Mesozoic and Paleozoic carbonate and siliciclastic rocks with minor volcanic rocks and Tertiary gravels), the McCullough Mountains (predominantly granite and gneiss with minor volcanic rocks in the south part; and predominantly volcanic rocks in the north part), and the Lucy Gray Mountains (predominantly granite and gneiss with minor amount of volcanic rocks). Alluvial fans are also present below principal drainages that head in the Sheep Mountain area (Paleozoic carbonate and siliciclastic rocks, minor Proterozoic granite and gneiss), and the Jean hills (informal name; Tertiary volcanic rocks and polylithic gravels).
Alluvial fan and wash deposits are composed predominantly of massive to moderately sorted, moderately to well stratified sands and gravels ranging from pebbles to boulders. Clast diameter generally increases with proximity to highland source areas. Notably boulder-rich deposits, often linked to debris flow deposition, are present near and within the interior parts of the major mountain ranges in the study area and are particularly common on alluvial fans fed by high-relief source areas with extensive outcrops of volcanic or granitic rocks. Older alluvial units are generally coarser grained than younger ones, but this may reflect the fact that the upper and middle parts of the associated alluvial fans are best preserved. In all deposits, the constituent clasts are subangular and moderately sorted, and they are crudely to moderately stratified. Degree of consolidation increases markedly with deposit age and ranges from very weak to very strong.
The study area, like most of the Mojave Desert, exhibits an array of alluvial deposits of widely varying ages. Alluvial fans of different ages on the map were distinguished on the basis of a suite of surficial and morphologic characteristics discussed earlier including these: topographic position; degree of dissection and nature of surface drainage pattern (e.g., tributary or distributary); alteration of original depositional morphology evident as progressive smoothing of surface morphology over time; development of gravel pavement; degree of chemical and physical weathering of surface clasts; and soil horizon development, particularly carbonate morphology (e.g., Gile et al., 1981; Birkeland, 1999; Bull, 1991; Christenson and Purcell, 1985; Machette, 1985).
Qay Young alluvium, undivided (latest Holocene to latest Pleistocene)
This is the undivided class of young alluvial deposits. It is comprised of predominantly coarse-grained alluvial fan and wash deposits from principal drainages in the Spring, Bird Spring, McCullough, and Lucy Gray Mountains and various local sources. The latter may include remnants of high-standing and incised older alluvial deposits. The unit is typically composed of subangular sandy pebble-cobble gravel with lesser amounts of sand and silty sand (relative proportions vary with nature of and proximity to source area). Deposits are generally crudely to moderately stratified. Boulder-gravels are common in upslope parts of Qay deposits in high-relief mountain interior and mountain front areas. In several of these cases there is strong local evidence for debris flow processes.
Surface and soil characteristics of Qay deposits depend strongly on relative age and frequency of fluvial activity. Surface morphology ranges from high relief, with fresh bar and channel forms reflecting original depositional morphology, to progressively more subdued bar and swale forms, to planar surfaces. Surface clast weathering ranges from nil to moderate varnish and carbonate clast etching. Well-developed gravel pavements present only in oldest subunit surfaces (Qay1). Relatively weak, loose pavements may be present in swales on surfaces of younger subunits. Associated soils range from nil to weak development of Bw and Bk horizons (up to stage 2 Bk in Qay1).
Qay3 Youngest active alluvium (Recent to late Holocene)
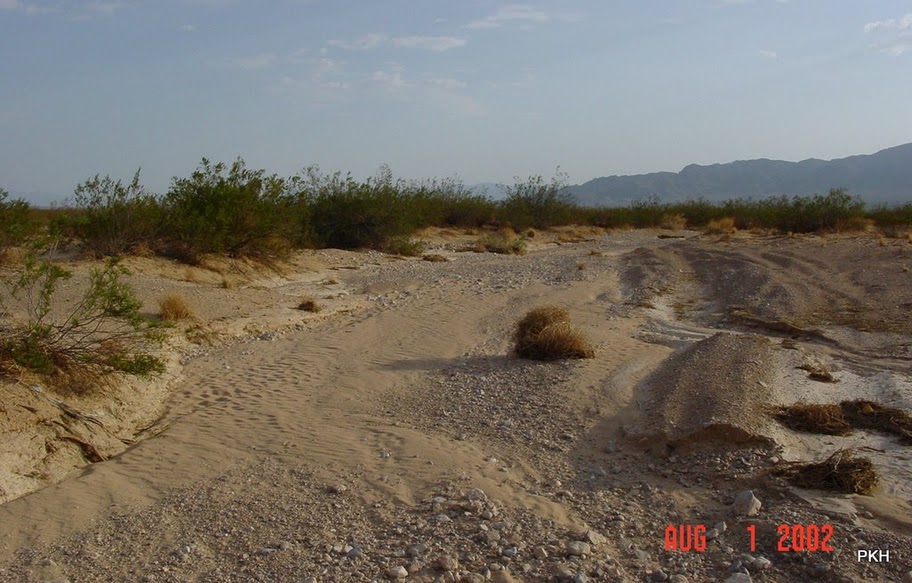
Figure 31. The active channel of Roach Wash, the principal axial drainage at the north end of Roach Lake. Fresh fluvial bedforms and bar features are obvious.
Active wash and alluvial fan deposits of poorly to moderately sorted gravel, sand, and minor silt. Fresh bar and channel morphology, relatively low density of vegetation, easily visible on aerial photographs and satellite imagery due to high albedo of fresh sand and gravel. Alluvial fan surfaces have obvious and complex distributary flow patterns, and broad, sheet-like gravelly areas with few obvious channels. Active washes are well-defined and range from single channels with low flanking terraces, to braided channels interspersed with gravel bars.
Active surfaces (modern) to latest Holocene with little to no carbonate morphology, often contain buried soil horizons. Characterized by C or Av horizons overlying Bw/Bk or buried Bk horizons. Vesicular A horizons vary from 1 to 8 cm thick and overlie either Bw (8–23 cm thick) or Bk (10–95 cm thick) horizons containing very slight carbonate coats underneath clasts. Surface clasts are minimally weathered and unvarnished.
Qay2 Young, active and recently abandoned alluvial surfaces (Late Holocene)
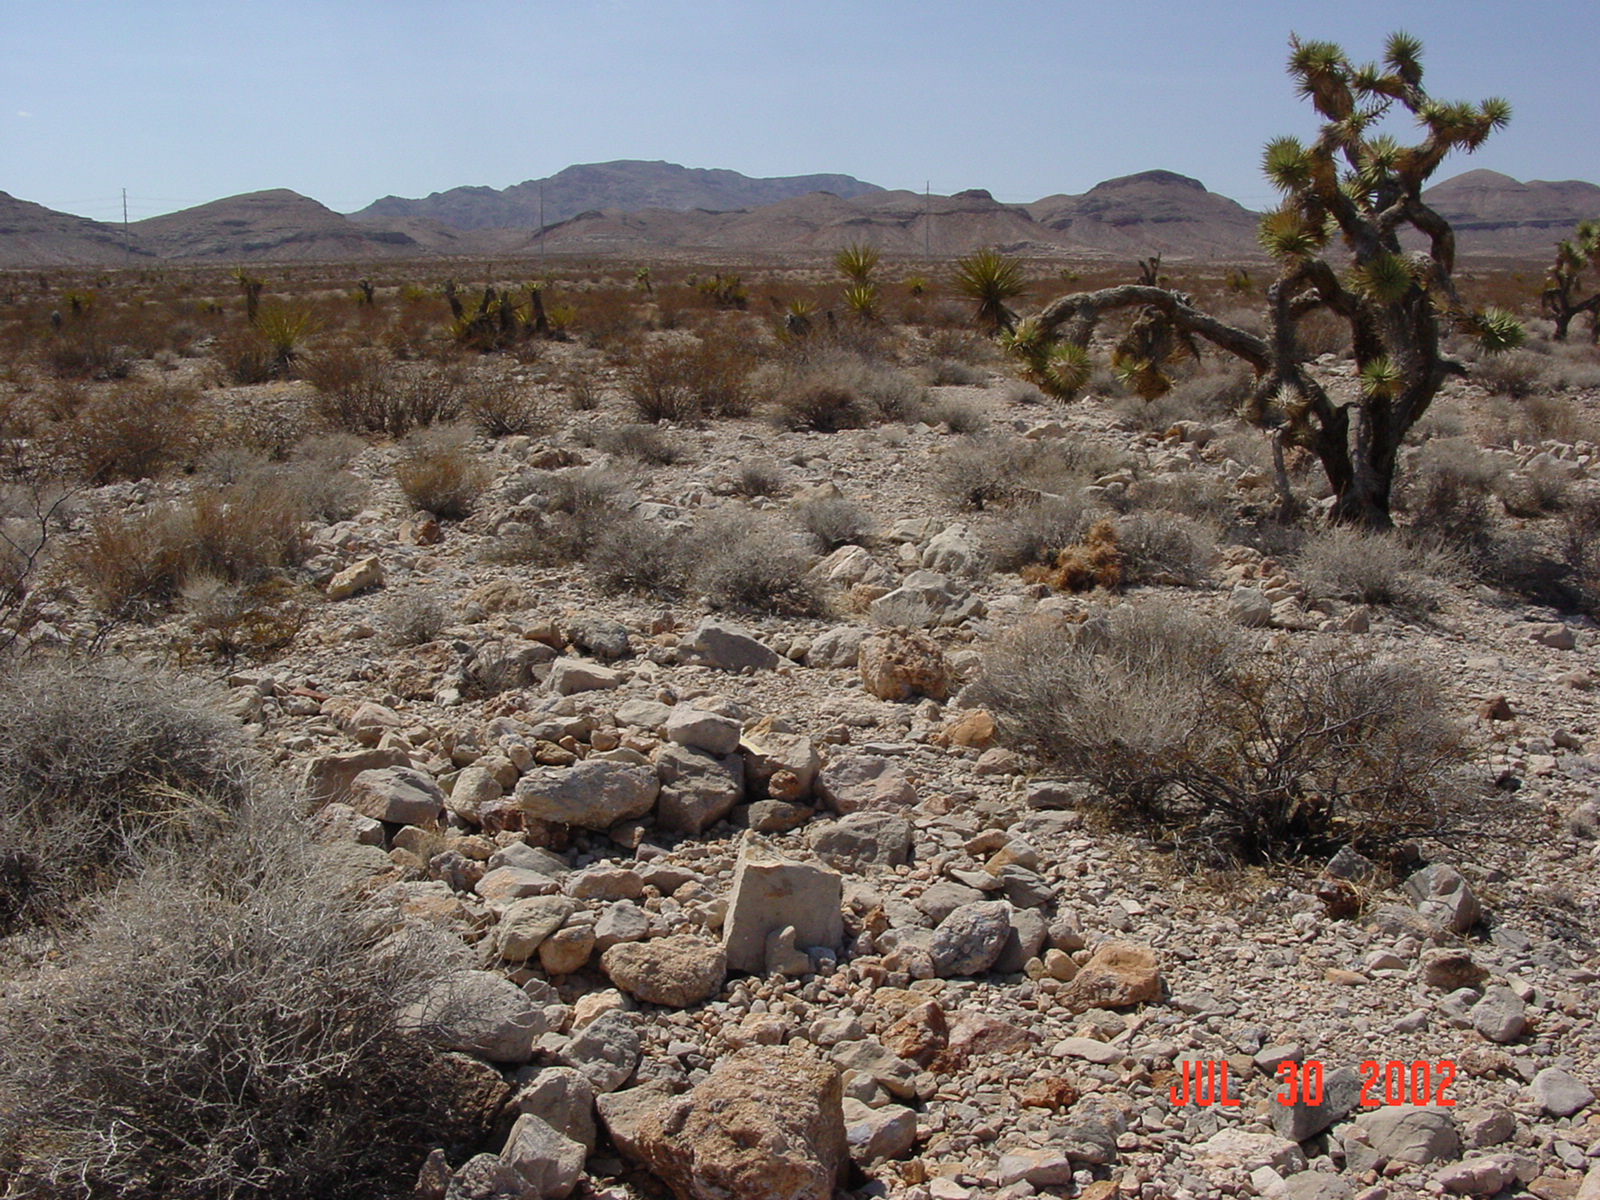
Figure 34. Typical Qay2 surface showing muted but obvious depositional topography and weakly weathered surface clasts.
This division of Qay includes intermittently active surfaces that flank and grade laterally from Qay3 surfaces and a group of somewhat older abandoned surfaces that are interpreted as morphologically and chronologically intermediate between Qay1 and Qay3.
The surface morphology of this unit shows some modification of original depositional topography and ranges from bar-and-swale to subdued bar-and-swale, often interspersed with semi-stable distributary channel networks. Surface clast weathering ranges from slight to moderate varnish and minor carbonate clast etching. Gravel pavements relatively sparse, but may be weakly to moderately developed in some swales. Distributary flow pattern clear on high-resolution satellite imagery and aerial photos, but tone can vary from bright white to dark gray depending on source lithology, vegetation density, and presence of biologic crust which is locally common.
Various mechanisms of the separation of this unit from Qay3 are plausible. In some cases, the presence of large tracts of Qay2 are related to hiatus in fluvial deposition associated with shifts in major alluvial fan feeder channels and little topographic separation is present between the two map units. In other cases, incision or deepening of a principal feeder channel has isolated large tracts of fans from active fluvial processes.
The Qay2 surface dates in the range of latest to middle-late Holocene (<5 to possibly 7 ka). The underlying soil is characterized by Bk horizons with weak to strong stage I carbonate morphology. A horizons (1–9 cm thick) commonly occur in granitic parent materials near Lucy Gray and McCullough Mountains. Elsewhere Av (4–5 cm thick) horizons overlie either Bw (4–10 cm) or Bk (2–111 cm) horizons. Unit is largely unconsolidated. Somewhat more consolidated, buried soils are commonly present at depth. The geologic map does not differentiate deposits in that particular circumstance for practical reasons and for map clarity.
Qay1 Youngest inactive alluvial surface (early Holocene to latest Pleistocene)
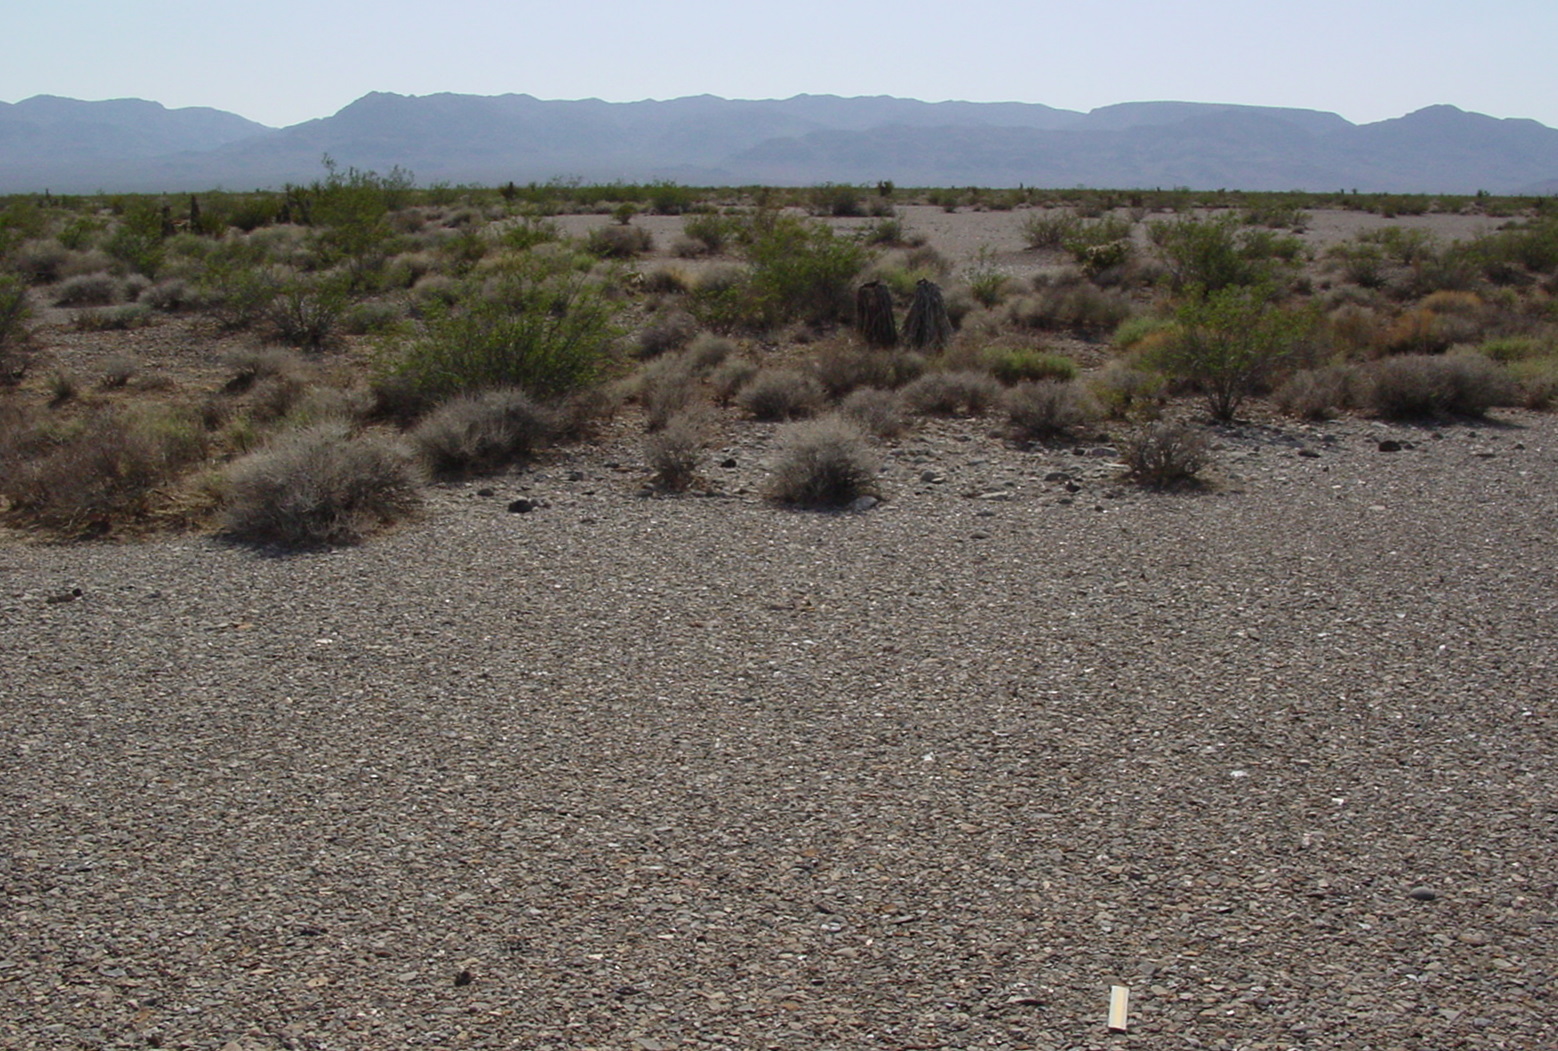 |
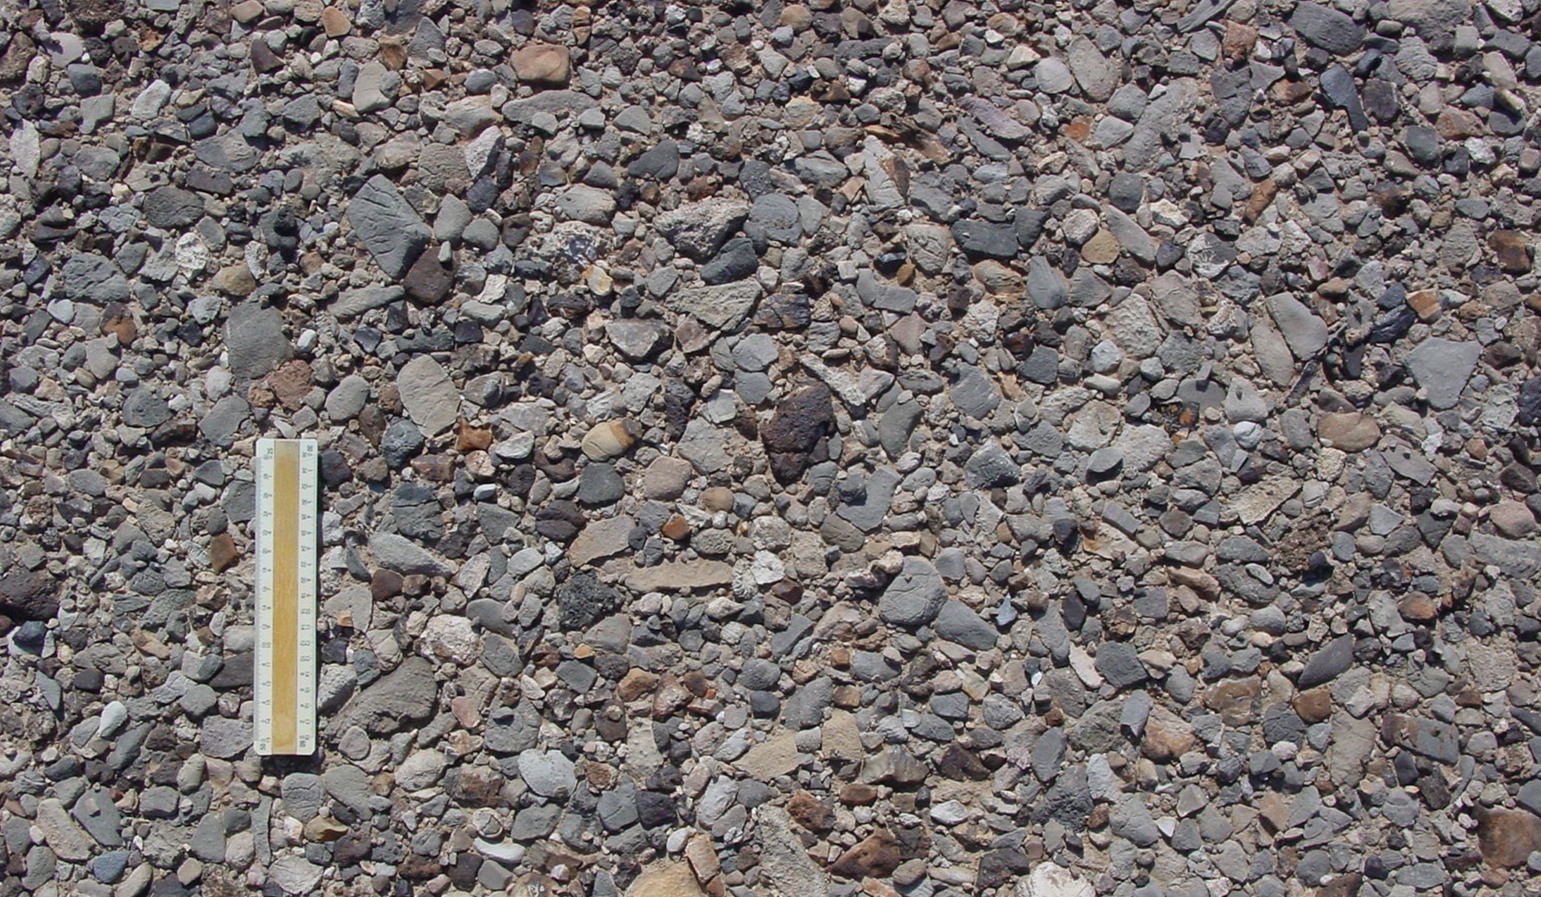 |
Figure 35. Typical distal Qay1 surface showing flat pavement with moderately interlocking surface clasts.
This is an extensive and distinctive unit in the study area and throughout the region. It is composed of the youngest series of inactive alluvial fan surfaces that have well-developed planar morphology. This unit is also distinctive for exhibiting moderate to strongly developed desert pavement, and moderate to dark (less typical) rock varnish. Minor etching of carbonate clasts is also common on Qay1 surfaces. The unit exhibits a distinctive aerial photograph pattern that is characterized by a “trellis” or “alligator skin” appearance expressed as lighter-toned roughly rectangular areas with gravel pavement separated by roughly rectilinear pattern of vegetation bands and active, incised channels. This pattern occurs on older, planar remnants (Qai) but is more typical of Qay1.
The Qay1 surface is an early Holocene-latest Pleistocene (7–15 ka) surface characterized by stage II carbonate morphology, and in granitic parent materials, argillic horizons. A or Av horizons (2–8 cm thick) overlie Bw (8–31 cm thick), Bt (8–18 cm thick), and/or Bk (10–61 cm thick) horizons. Bk horizons may contain strong stage I carbonate morphology, but more commonly display stage II carbonate morphology. Argillic horizons contain clay cutans on sand grains.
Qai Intermediate alluvium, undivided (middle to late Pleistocene)
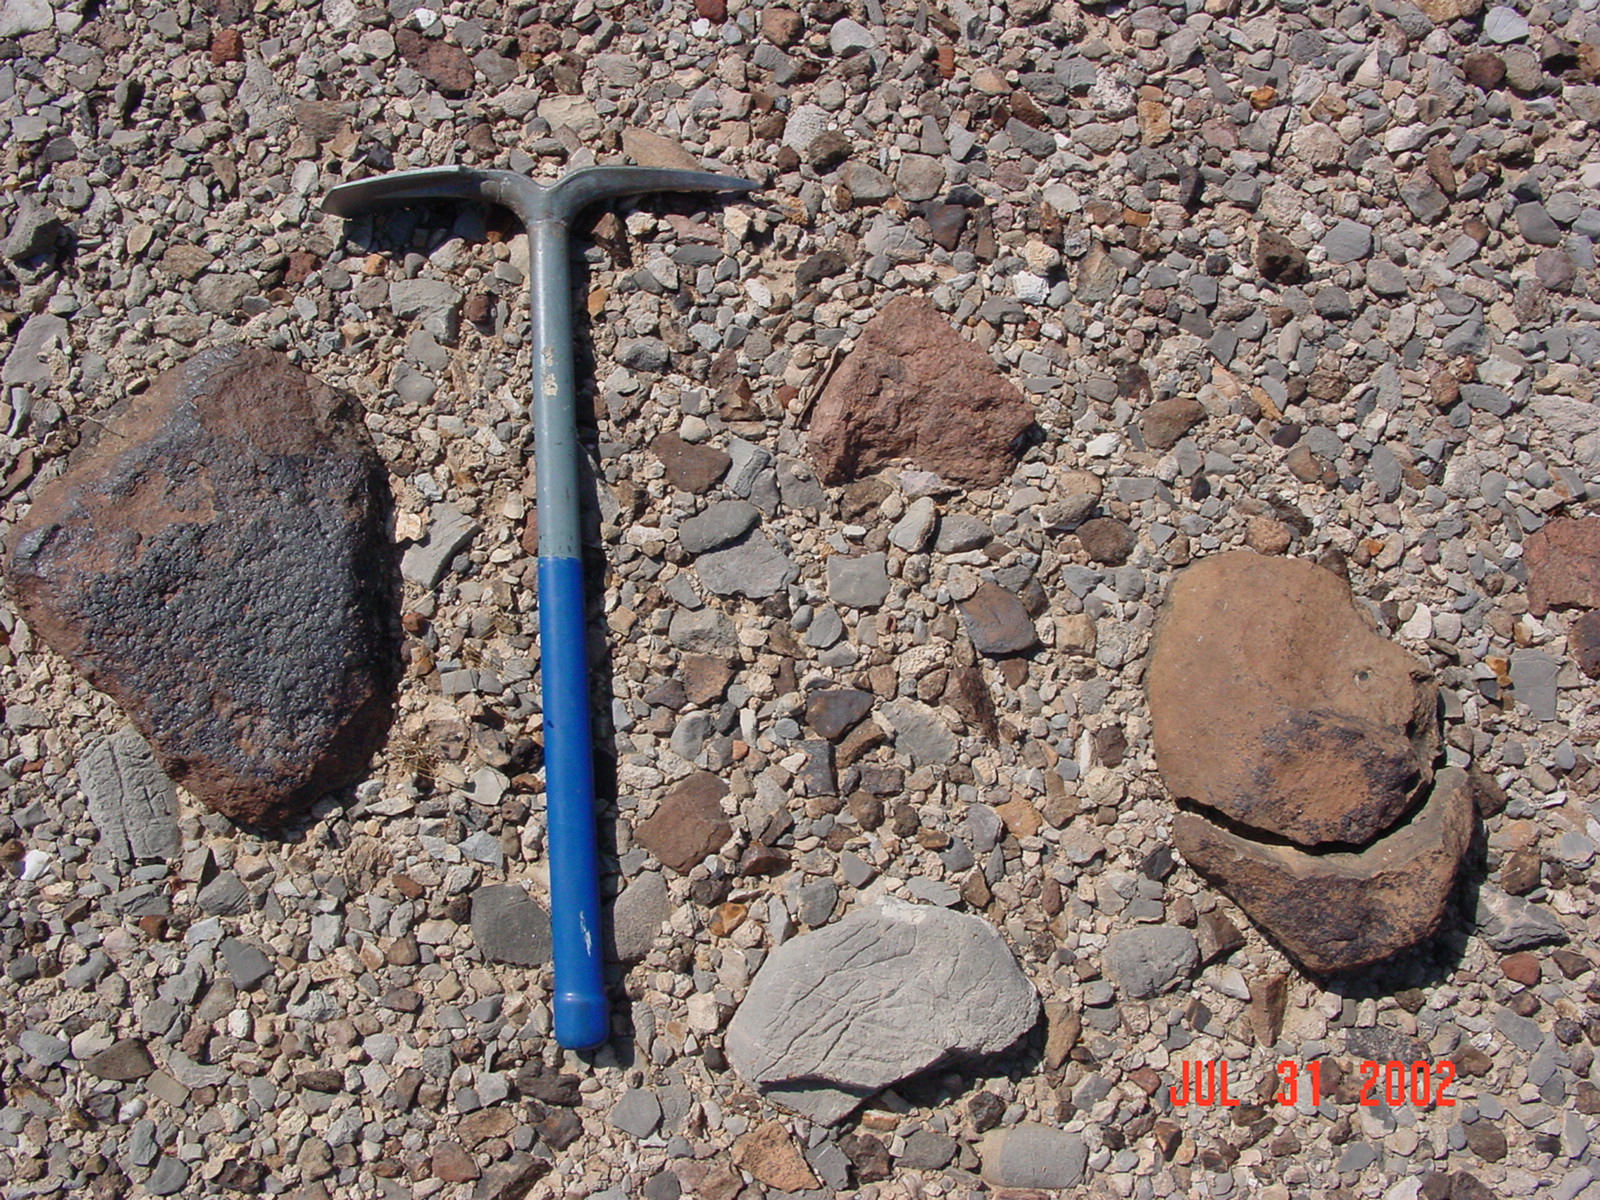 |
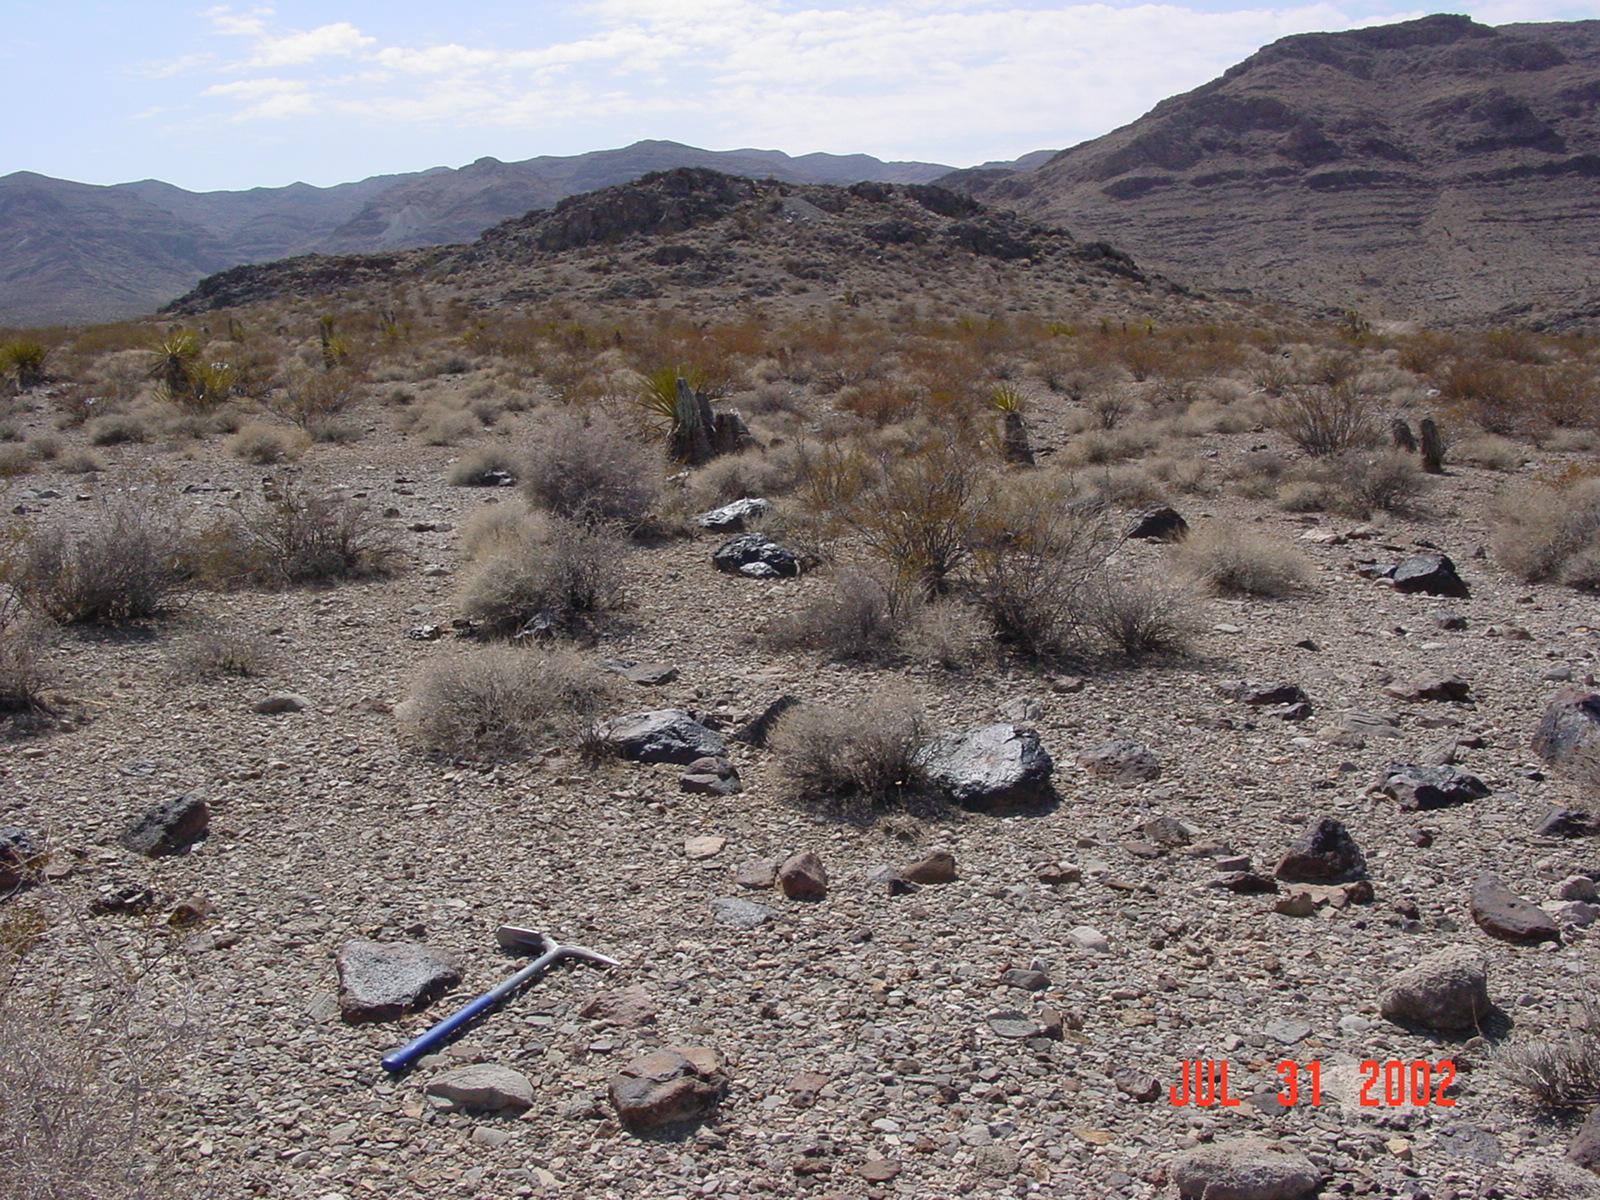 |
Figure 36. Typical medial Qai surface remnant showing flat surface with moderate to tightly interlocking pavement and strongly weathered clasts.
Deposits and surfaces of relict, inactive alluvial fans. Undivided unit includes up to three subunits that are locally divisible on basis of slight differences in soil carbonate horizon development and topographic position (the latter characteristic is only easily discerned where subunits are adjacent to one another). Overall, surface characteristics of the various subunits are very similar in imagery and in the field. Thus, consistent division is difficult without extensive field work. Qai surfaces are distinctly planar with strongly developed gravel pavement and dark to very dark varnish on surface clasts of siliceous composition. Many surface clasts are strongly weathered. Deeply etched and pitted carbonate clasts; and split, shattered, and disaggregated clasts of crystalline rocks, where present, are common. Surface drainage has tributary pattern and depth of channel incision generally ranges from 2 to 5 m.
Qai deposits are moderately to strongly consolidated. Soil development ranges from stage III to incipient stage IV carbonate morphology. The youngest subunit within Qai is possibly as young as late Pleistocene (30–75 ka), the older and more widespread subunit(s) are likely late-middle Pleistocene (75–300 ka). Typical Qai soils are characterized by stage III to incipient stage IV petrocalcic carbonate morphology. A/Av/Avk horizons (1–7 cm thick) overlie Bw (8–10 cm thick); Btk (occurs in granitic alluvium only, 77 cm thick); Bk (20–89 cm thick), and/or Bkm (20–197 cm thick) horizons. Carbonate morphology increases with depth. Bk horizons display strong stage I to stage II carbonate morphology and overlie stage III Bkm petrocalcic horizons.
Qao Old alluvium, (middle to early Pleistocene)
Deposits and surfaces of very old alluvial fans remnants. Typically characterized by concordant to discordant, weakly to moderately crowned surface remnants separated by deeply (3–6 m) dissected tributary drainage networks. Surface clasts include moderately to deeply weathered fluvial pebble and cobble and sparse boulder gravels; abundant angular clasts derived from petrocalcic horizons; exposed mantle of aeolian silt locally common. Abundant surface carbonate litter results in somewhat lighter to much lighter tone in aerial photographs and satellite imagery than Qai and Qay1 surfaces.
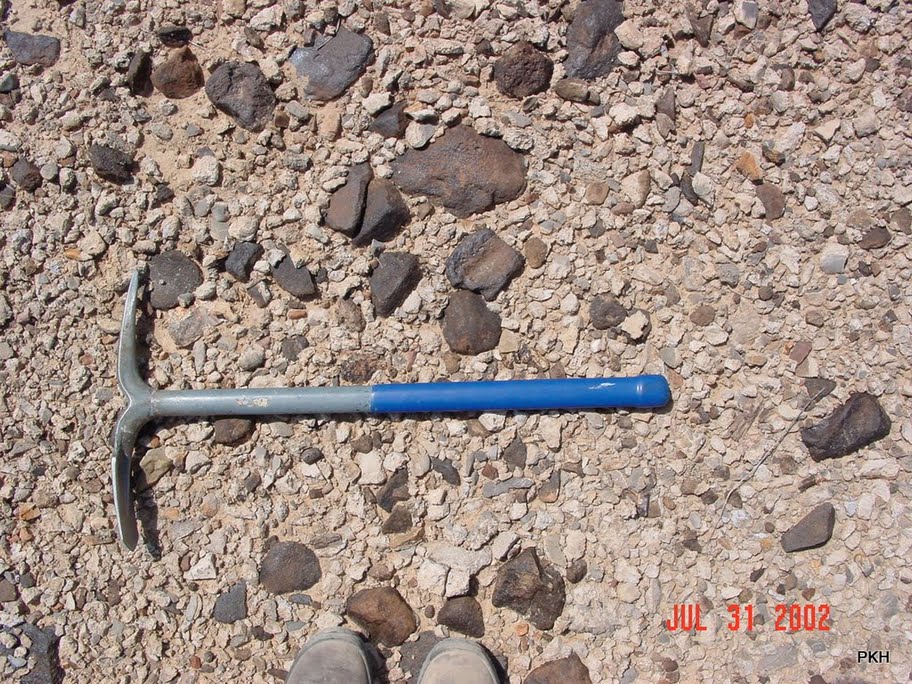 |
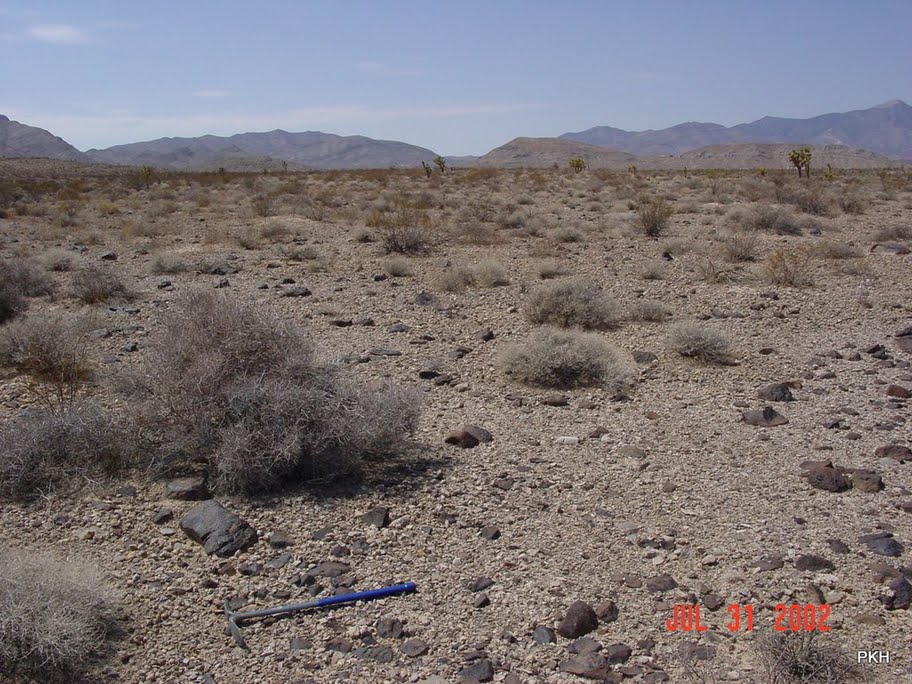 |
Figure 37. Typical Qao surface showing variably paved surface composed of abundant petrocalcic chips and darkly varnished rock fragments.
Soils characterized by strongly developed, thick, stage IV to V petrocalcic horizons. A/Av/Avk (1–8 cm thick) overlies either Btk (9–39 cm thick) or Bk (16–38 cm thick) horizons that display stage I–II carbonate morphology. Btk horizons occur in granitic parent materials in the southeast part of the study area and contain well developed clay coats and clay bridges between sand grains. The underlying, strongly indurated, Bkm horizon (50+ cm thick) is characterized by a laminar cap <1 cm thick.
QTa Old alluvium, undivided (early Pleistocene to late Miocene(?))
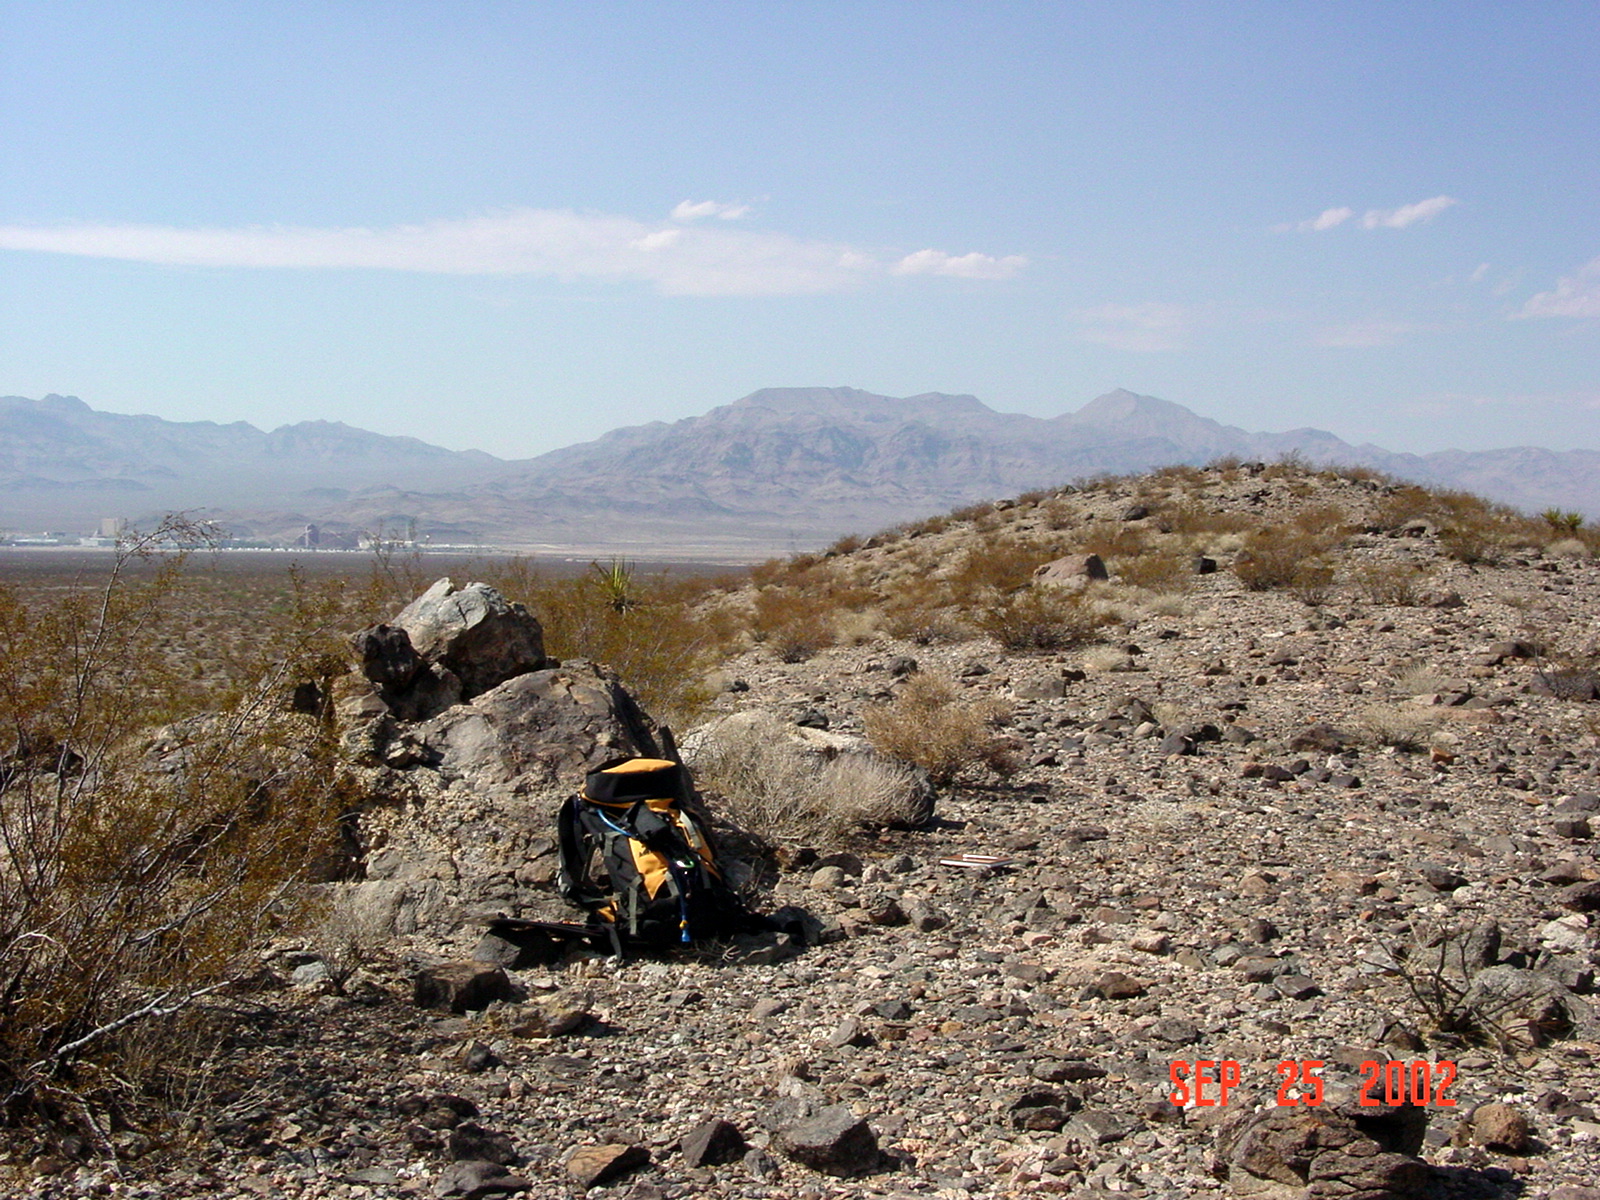
Figure 38. Eroded, ridge-like remnant of QTa showing deeply weathered clasts and retrograde pavement on moderate to steep slopes.
Deposits and surfaces of very old to ancient alluvial fan remnants, includes undivided Qao and Tay (see below). Deposits consist predominantly of subangular to subrounded gravel. Surface morphology ranges from deeply dissected ridge-and-ravine topography with roughly concordant ridge crests to isolated ballenas with discordant ridge crests. Deeply dissected areas with well preserved petrocalcic horizons may locally exhibit planar topography where eroded to the petrocalcic horizon. Surface clasts include deeply weathered fluvial pebble to cobble gravel, large angular clasts of disaggregated petrocalcic soil horizon(s), and abundant small angular clasts of soil carbonate litter in an extensive surficial matrix of calcareous silt. Gravel pavements rare except locally on surface crests and side slopes where they are interpreted as retrograde features. QTa deposits overlie well-exposed bedrock erosion surfaces in some upper piedmont areas. Carbonate litter and exposure of intact indurated carbonate horizons imparts light tone to surface in aerial photographs and satellite imagery.
Soils characterized by strongly developed stage IV, V, or VI petrocalcic horizons. Commonly, the overlying horizons have been eroded exposing the petrocalcic horizon at the surface. The high variability in carbonate morphology is a result of deflation of the surface, which leads to the erosion of the morphologic features (esp. thickness of laminar cap) that define stages IV, V, or VI carbonate morphology. Where exposed, the petrocalcic horizon can be 2+ m thick. Where overlying horizons are present, one or more of the following are observed: A (2–8 cm thick), Bw (15–17 cm thick), Bt (25 cm thick) in granitic parent materials, and Bk (20–29 cm thick) containing stage I and II carbonate morphology.
Tay Ancient alluvium (Pliocene to late Miocene(?))
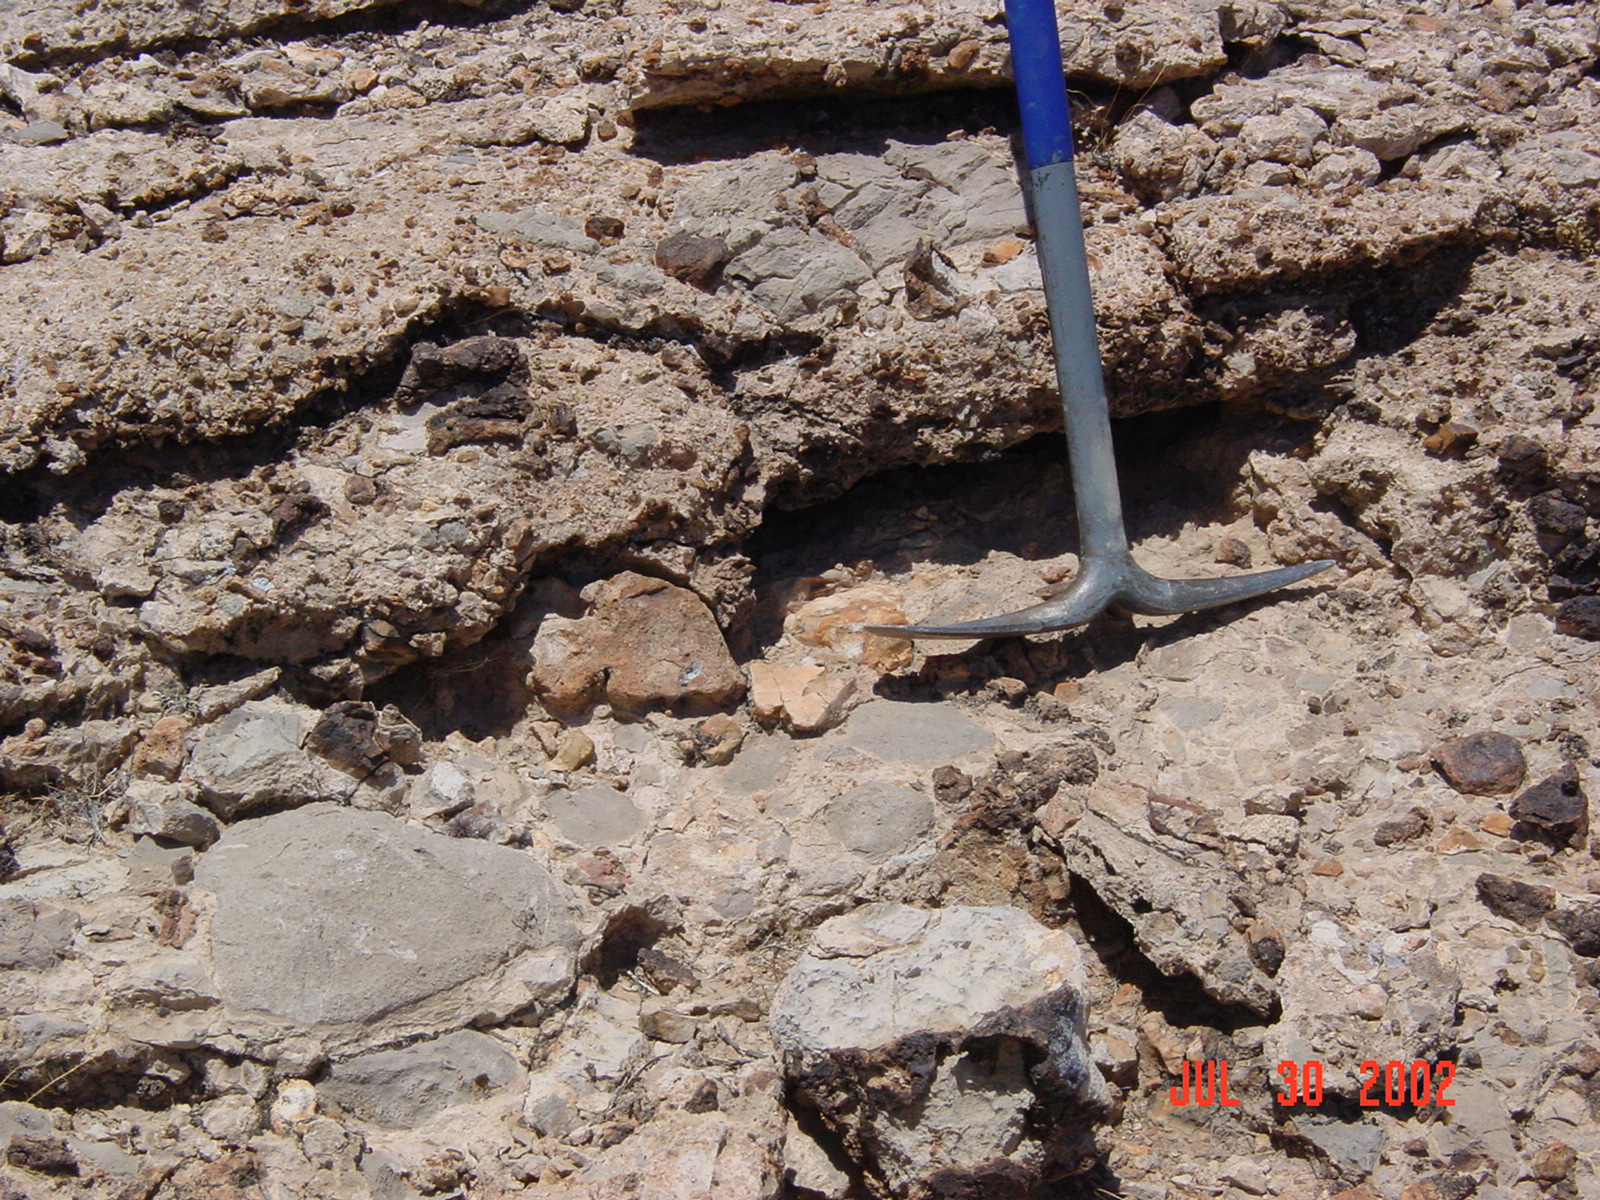 |
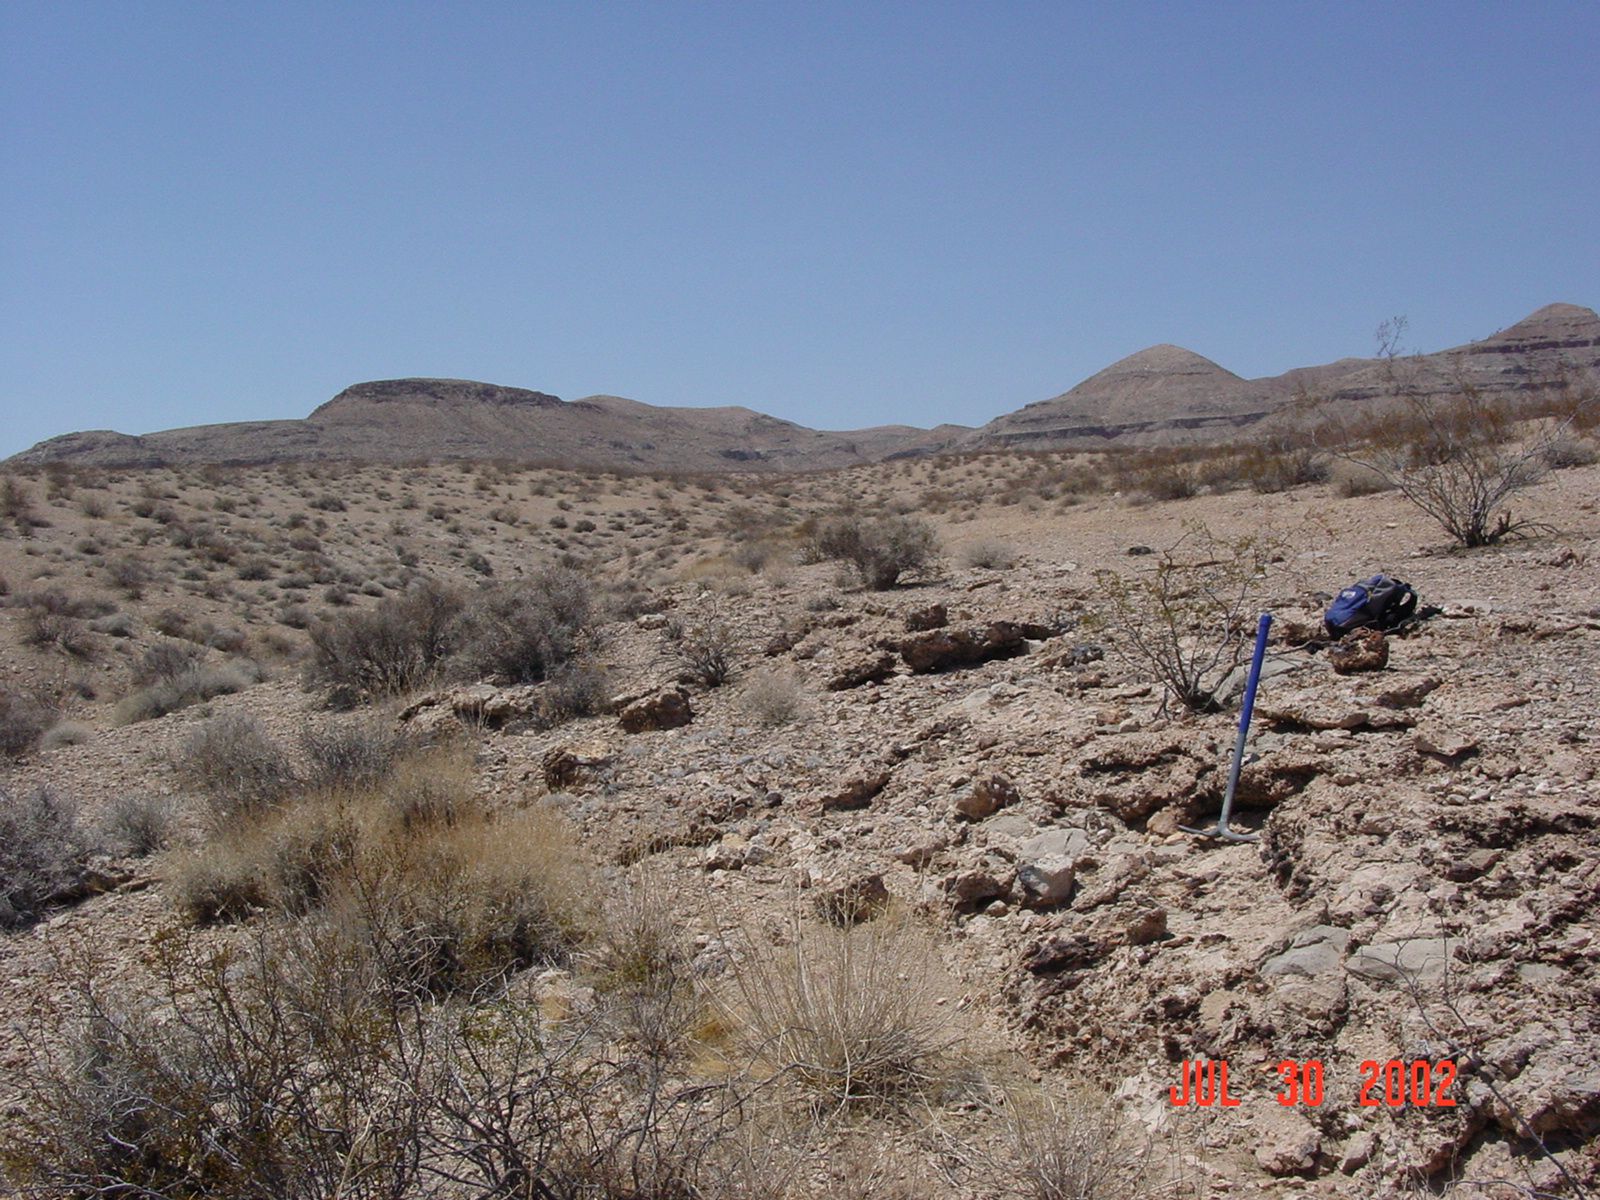 |
Figure 39. Typical outcrop and surface expression of Tay showing very strongly cemented carbonate horizon.
Deposits and surfaces of ancient alluvial fans. Deposits consist predominantly of subangular to subrounded gravel. Unit surface is characterized by strongly developed stage VI petrocalcic horizons developed in coarse alluvium. Commonly, the overlying soil horizons are eroded, leaving a surficial rubble layer of broken petrocalcic fragments and exposing the petrocalcic horizon at the surface. The petrocalcic horizons are characterized by multiple crosscutting laminae that can be up to 15 cm thick, multiple pisoliths, and ooids (often concentrated in 1- to 3-mm-thick zones within laminar layers). Where overlying horizons are present, one or more of the following may be present: C (recent aeolian sediment), Av, and/or Bk (containing stage I, or II) horizons of variable thickness. Where fully exposed, Tay petrocalcic horizons can be 3+ m thick. Unit has very light tone in aerial photographs and satellite imagery.
Many (most?) exposures of Tay remnants are located in areas of deep dissection, and the relict surfaces occur as relatively high-standing features. The typical remnant occurs as a mesa-like feature capped with a layer of strongly carbonate-cemented alluvium that overlies an eroded bedrock surface.
Bedrock Units
The surficial geologic map shows only principal bedrock units divided on the basis of major lithologic characteristics, including the following: Middle Miocene siliciclastic sedimentary rocks (conglomerate, sandstone, and minor mudstone); Mesozoic and Paleozoic sedimentary rocks (carbonate and siliciclastic, undivided); Miocene volcanic rocks (undivided rhyolite, andesite, and basalt); Miocene to Cretaceous silicic intrusive rocks; and Proterozoic crystalline basement rocks (granite, quartz monzonite, and granitic gneiss, undivided). No structure or individual formations are shown. Previously published bedrock maps showing bedrock structure and individual formations in this study area are cited in each general category below. The contacts between surficial geologic units and bedrock units were developed with high-resolution imagery and field reconnaissance in the compilation of this map and may not exactly coincide with contacts in the previously published maps.
Tv Volcanic rocks, undivided (middle to late? Miocene)
Includes numerous volcanic rock units ranging in composition from basalt to rhyolite (Bingler and Bonham, 1972; Bridwell, 1991; Hewett, 1931, 1956; Kohl, 1978;). Extensive exposures occur in the Hidden Valley, Jean hills, and Table Mountain areas. Smaller outcrops overlie Tao in the Bird Spring Range and in the upper piedmont of the McCullough Mountains. Minor Tv outcrops occur on the upper piedmont of the southern Spring Mountains. Also of note is a stratum of subrounded pebbles of pumice and obsidian in a fine-grained, white, ashy(?) matrix that crops out along the east side of the wash that transects the Jean hills.
Tao Middle (?) Miocene sediments
Deposits of subrounded to rounded, coarse-grained fluvial gravels (up to large boulders) and minor lithic sandstone and mudstone. Clast composition includes abundant subrounded to well-rounded quartzite clasts, which are uncommon in all younger alluvial deposits in the study area (the “early gravels” of Hewett, 1931). Gravels are generally clast-supported, moderately sorted to well sorted, well bedded, and commonly tilted and crossed by small faults. Relict Tao deposits are commonly associated with well-developed, high-standing ballena landforms that are characterized by highly degraded, possibly multiple petrocalcic soils with relict stage III or greater carbonate morphology. A series of Tao ballenas north of Jean define a distinctly linear trend that may be fault controlled. A large Tao outcrop to the immediate northwest of Goodsprings exhibits a thick, tilted sequence of Tao that contains a substantial thickness (>5 m) of carbonate-cemented gravel.
Tao gravels rest unconformably on Mesozoic and Paleozoic sedimentary rocks (MzPzs) and are overlain by a sequence of middle Miocene volcanic rocks (Tv). This relation was first noted in the Jean area by Kohl (1978) and is particularly well expressed in the ridges north of Jean. In a deep wash cut through the hills northeast of Jean (informally named the “Jean hills”), a sequence of lithic sandstone, pebble conglomerate, and minor mudstone are included in Tao. The fine-grained deposits have only been noted in small outcrops there and in a small area at the foot of the southern Spring Mountains in the State Line Pass quadrangle. The stratigraphic relation between the fine-grained and coarse-grained deposits is unresolved. In the Jean hills, there is a thin volcanic sequence containing pebble- to cobble-sized clasts of pumice and obsidian in an apparent interbedded relationship with Tao sediments.
TKi Intrusive igneous rocks (middle Miocene to Cretaceous)
Undivided unit includes fine-grained rhyolite plug comprising Devils Peak and coarsely porphyritic granite intrusions north and west of Goodsprings (Hewett, 1931; Carr and Pinkston, 1987).
MzPzs Sedimentary rocks, undivided (Mesozoic to Paleozoic)
Includes numerous carbonate (limestone and dolomite) and siliciclastic (sandstone, mudstone, and conglomerate) rock units spanning the Paleozoic and Mesozoic. Composite unit is locally folded and is extensively cut by a series of major thrust faults and younger normal faults (Burchfiel, et al., 1974; Hewett, 1931, 1956; Longwell et al., 1965; Carr and Pinkston, 1987; Garside et al., 2009). These rocks form the bulk of the Spring Mountains, Bird Spring Range, and Sheep Mountain.
YXg Crystalline basement rocks (Proterozoic)
Includes granite, granite gneiss, granitic augen gneiss, and quartz monzonite. These rocks form the bulk of the Lucy Gray Mountains, and the south range of the McCullough Mountains (Bingler and Bonham, 1972; DeWitt et al., 1989). Unconformable onlap of MzPzs rocks (the “Great Unconformity”) is exposed in a few locations along the base of the the south and southwest face of Sheep Mountain.
Table 2. Areal extents and relative percentages of all geologic map units in study area.
Map Unit |
Area, mi2 |
%of map |
%of class |
||
Bedrock |
150.89 |
39.02% |
100.00% |
||
|
MzPzs |
75.83 |
19.61% |
50.25% |
|
|
Tv |
30.61 |
7.92% |
20.29% |
|
|
Yxg |
40.05 |
10.36% |
26.54% |
|
|
Tki |
1.21 |
0.31% |
0.80% |
|
|
Tao |
2.56 |
0.66% |
1.70% |
|
|
Tek |
0.63 |
0.16% |
0.42% |
|
Alluvium |
209.03 |
54.06% |
100.00% |
||
|
Qay |
9.45 |
2.44% |
4.52% |
|
|
Qay3 |
76.03 |
19.66% |
36.37% |
|
|
Qay2 |
28.73 |
7.43% |
13.74% |
|
|
Qay1 |
38.76 |
10.02% |
18.54% |
|
|
Qai |
29.46 |
7.62% |
14.09% |
|
|
Qao |
10.75 |
2.78% |
5.14% |
|
|
QTa |
13.89 |
3.59% |
6.65% |
|
|
Tay |
0.84 |
0.22% |
0.40% |
|
|
Qc |
0.56 |
0.15% |
0.37% |
|
|
Qcf |
0.56 |
0.14% |
0.37% |
|
Aeolian |
15.28 |
3.95% |
100.00% |
||
|
Qe |
2.75 |
0.71% |
18.00% |
|
|
Qea |
9.98 |
2.58% |
65.30% |
|
Playa |
7.22 |
1.87% |
100.00% |
||
|
Qp |
7.22 |
1.87% |
100.00% |
|
|
Qpf |
2.55 |
0.66% |
35.37% |
|
Disturbed |
|
|
|
||
|
Qx |
4.26 |
1% |
100% |
|
Age Estimates of the Surficial Units
We estimated the ages of surficial map units in the Ivanpah Valley study area by comparing our observations to those reported from studies in similar settings in the same general region. For example, soils in the Ivanpah study area are correlative to those found on alluvial fans below the Spring Mountains and the Sheep Range in the general vicinity of Las Vegas and Pahrump, NV (Sowers et al., 1988; Bell et al., 1998, 1999; Page et al., 2005). The parent materials for alluvial fans in these areas are quite similar to most of the Ivanpah map area (predominantly Mesozoic and Paleozoic sedimentary rocks), and they were presumably subject to the same general climate throughout the Quaternary. Other study areas located in the larger general region include the Silver Lake and Providence Mountain areas in the central Mohave Desert south of Ivanpah Valley (McDonald et al., 2003; Wells et al., 1987; Reheis et al., 1989; Harden et al., 1991); and the vicinity of the Nevada Test Site, north of the Ivanpah Valley area (Taylor, 1986; Harden et al., 1991; Peterson et al., 1995).
Las Vegas and Pahrump Valleys
Kyle Canyon is a major drainage in the Spring Mountains west-northwest of Las Vegas. A large alluvial fan complex associated with Kyle Canyon on the eastern piedmont of the range has been the site of several geological investigations. Sowers et al. (1988) and Reheis et al. (1992) describe four geomorphic surfaces (Surfaces 1–4) on the Kyle Canyon alluvial fan. Bell et al. (1998) use the same units for mapping the alluvial fan but subdivide Surface 3 into 3a and 3b on the basis of inset relations and differences in soil development where applicable. Soil carbonate descriptions vary somewhat among studies for the same units (Sowers et al., 1988; Reheis et al., 1992; Harden et al., 1991; Bell et al., 1998). Sowers et al. (1988) used U-Th (uranium series), 14C, and paleomagnetism to estimate soil ages. Their reported U-Th ages are minima for several reasons, including that the analyses focused on inner rinds of carbonate pendants, which were later found to often contain some of the youngest laminae (Brock and Buck, 2005).
Kyle Canyon Surface 4 (Sowers et al., 1988) and unit Qa of Bell et al. (1998) comprise active alluvial surfaces with little to no soil development; the corresponding unit in the Ivanpah Valley study area is Qay3. Unit Q4 of Bell et al. (1998) is a less frequently active to recently abandoned surface. Thus, it is a slightly older part of the undivided unit Q4 of Sowers et al. (1988), and it overlaps in age with parts of Ivanpah units Qay3 and Qay2.
Surface 3 in the Kyle Canyon area occupies a stratigraphic position between active and recently abandoned surfaces of middle-late Holocene age and long-abandoned stable surfaces with strongly developed soils and weathered surfaces of Pleistocene age. Kyle Canyon Surface 3 corresponds primarily to Ivanpah unit Qay1 and, possibly, younger parts of undivided Ivanpah unit Qai. Soil descriptions for Kyle Canyon Surface 3 vary among authors. It contains pedogenic carbonate morphology that has been described as ranging from stage I to stage III (Sowers et al., 1988; Bell et al., 1998; Harden et al., 1991;). Bell et al. (1998) subdivide this unit into Qsp3b (younger) and Qap3a (older) based on inset relations and slight differences in surface morphology and soil development evident in some areas. This subdivision corresponds with the division between Qay1 and younger parts of Qai in the Ivanpah Valley area.
Several absolute dating methods have been applied to material within this unit and results vary from 76 ka (Uranium-series dating of pendants) to 4 ka (organic 14C) (Sowers et al., 1988). Several 14C dates of pedogenic carbonate range between 10–15 ka (Sowers et al., 1988). Bell et al. (1998, 1999) report that Q3b deposits overlie fine-grained axial valley deposits that date to between 9 and 12 ka, early Holocene to Latest Pleistocene. Descriptions of strong stage II to stage III carbonate morphology in upper piedmont parts of Surface 3 in Kyle Canyon (Sowers et al., 1988) and unit Qsp3a of Bell et al. (1998) are similar to younger parts of undivided Ivanpah unit Qai. Descriptions of surface morphology comparison to Sowers et al., (1988) and Bell et al., (1998) suggest that the younger parts of undivided Ivanpah unit Qai are late Pleistocene.
Surface 2 in Kyle Canyon is characterized by a stage IV petrocalcic horizon that is in many places, eroded with petrocalcic fragments littering the surface (Sowers et al., 1988; Bell et al., 1998). These characteristics closely correlate to Ivanpah map unit Qao and possibly older parts of undivided unit Qai. Sowers et al., (1988) have averaged U-Th dates of 129 ka; 14C CaCO3 date of 34 ka; and 14C org date of 18 ka. Paleomagnetic data on the petrocalcic horizon of Surface 2 suggest that it is <730 ka. This surface, then, has a reasonably firm middle Pleistocene age.
Sowers et al., (1988) describe Surface 1 as comprised of deeply dissected, discordant, rounded fan remnants (ballenas) littered with petrocalcic soil fragments and underlain by stage IV petrocalcic horizon. Bell et al. (1998) describe this same unit as having a 3 to 5 m thick stage V petrocalcic horizon. The soil development in this unit and the general morphology most closely correlates to Ivanpah map unit Qao, and some QTa surfaces. Kyle Canyon Surface 1 has U-Th dates on pendant inner-rinds that vary between 88 and >350 ka; and paleomagnetic data that indicate an age >730 ka (Sowers et al., 1988). The strongly developed petrocalcic soils in Ivanpah units Qao and QTa suggest ages more closely in line with the paleomagnetic data: middle to early Pleistocene.
Page et al. (2005) compiled existing and new mapping of surficial deposits in the Las Vegas and Pahrump Valleys and report new mineral luminescence, 14C, and U-series age estimates on Quaternary deposits. Their alluvial fan units (Qay, Qayy, Qayo, Qaiy, Qai, Qao, and QTa) can be correlated to Ivanpah map units. Page et al. (2005) use stages of pedogenic carbonate accumulation to describe their alluvial map units. In the Las Vegas and Pahrump Valleys, map unit Qayy encompasses soils that range from little/no development in modern arroyos to those that contain stage I–II pedogenic carbonate. This map unit best corresponds to map units Qay3 and Qay2 (stage I) in the Ivanpah Valley. Although both of these units contain a lower stage of carbonate morphology (none-stage I) as compared to that described for Qayy (stage I–II), other geomorphic characteristics support this correlation.
Page et al. (2005) map unit Qay contains stage I–II pedogenic carbonate and overlies deposits near that date to between 8 and 12 ka. This unit correlates to portions of Ivanpah map units Qay2 (stage I carbonate), and Qay1 (stage II carbonate). Deposits of Qayo are described has also having stage I–II carbonate morphology and locally overlie deposits dated to 10–16 ka (Page et al., 2005). Qayo is interpreted to be early Holocene-latest Pleistocene and correlates with Qay1 (stage II) in Ivanpah Valley. Younger intermediate fan alluvium (Qaiy) in the Las Vegas and Pahrump areas are defined by stage II to IV carbonate morphology. Qaiy is correlated to Qfiy on Fortymile Wash, Nevada, which has been dated between 25 to 40 ka (Lundstrom et al., 1999). This unit most closely corresponds to the undivided Ivanpah map unit Qai, which has strong stage II to incipient stage III carbonate morphology and is interpreted to be late Pleistocene in age.
Page et al. (2005) map unit Qai is described as having stage II to IV carbonate morphology; a thermoluminescence date of 100–120 ka; it corresponds to undivided Ivanpah map unit Qai, which typically has stage III carbonate development. The next older unit, Qao, is characterized by a stage IV petrocalcic horizon that in many places is partially eroded leaving carbonate fragments as clasts on the surface. Qao is interpreted to be Pleistocene in age, and in part contains deposits of middle and late Pleistocene age (Page et al., 2005). Qao corresponds to the map unit of the same designation, Qao, in Ivanpah Valley. Their oldest alluvial unit, QTa contains a stage IV petrocalcic horizon, but has evidence of significant erosion. This indicates that the deposit is older than the extant surface. This unit correlates to units QTa, Tek, Tay, and possibly Tao(?) in the Ivanpah Valley area.
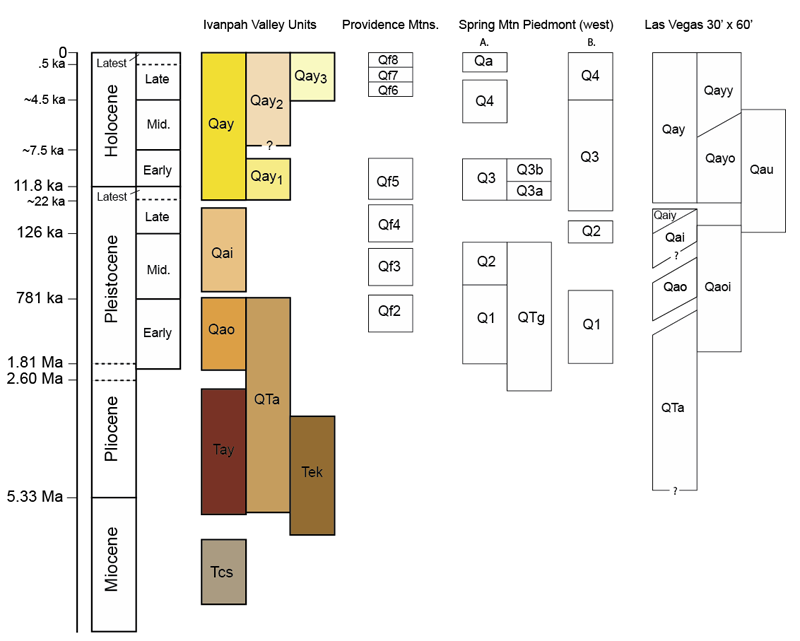
Figure 40. Comparison of Ivanpah Valley alluvial units to piedmont alluvial chronologies reported from proximate sites in the Mohave Desert. Providence Mountain data from McDonald et al., 2003; Spring Mountain piedmont data from: A. Bell et al., 1997, 1998; B. Sowers et al., 1988; Las Vegas 30’ x 60’, Page et al., 2005. Ages and representative durations in individual units are, in part, approximated. Geologic time scale based on USGS and ICS.
Eastern Mohave Desert
McDonald et al. (2003) described soils and summarized a variety of age estimates for seven Quaternary surficial alluvial units and three related aeolian units on the piedmont of the Providence Mountains, which lie south of Ivanpah Valley (Qf8, Qf7, Qe3, Qf6, Qe2, Qf5, Qe1, Qf4, Qf3, and Qf2). Their reported age estimates are based on IRSL and 14C analysis and modeling. Their unit Qf8 is active alluvium and corresponds to Ivanpah unit Qay3. Their unit Qf7 has stage I soil carbonate and a radiocarbon age range of approximately 4.4 to 5.9 ka. This unit correlates to Ivanpah unit Qay2 and younger parts of Qay. A related aeolian unit (Qe3) has a reported IRSL age of 4.3 ka.
McDonald et al. (2003) unit Qf6 has stage I to II carbonate, a generally weak pavement, and an estimated radiocarbon age range of approximately 4 to 6.2 ka. We also correlate this to Ivanpah unit Qay2 and parts of Qay. Unit Qf5 from the Providence Mountains area is characterized by a stage II to III carbonate soil, and moderate to strong pavement; it has a reported age range of approximately 10 to 22 ka And correlates to Ivanpah unit Qay1 and, possibly, younger parts of Qai. Providence Mountains piedmont Units Qf4, Qf3, and Qf2 have strong stage III, stage IV, and stage V carbonate soils, respectively (McDonald et al., 2003) and correlate to Ivanpah units Qai, Qao, and QTa/Tay.
Nevada Test Site Vicinity
Taylor (1986) and Harden et al. (1991) described alluvial units and soils near Fortymile Wash, NV, east of Yucca Mountain. Peterson et al., (1995) described seven surficial units in nearby Crater Flat, southern Nevada (Q1a, Q1b, Q1c, Q2a, Q2b, Q2c, QTa). Based on soil characteristics, the following correlations can be made to surficial units in Ivanpah Valley: Q1a and Q1b contain little (weak stage I) to no pedogenic carbonate and are correlated to Qay3. Q1c contains weak stage I (Peterson et al., 1995) to stage II carbonate morphology (Harden et al., 1991) and is correlated to Qay2 (stage I; for Crater Flat) or Qay1 (stage II; for Fortymile Wash). Q2a soils at Crater Flat can be correlated to Qay1, although Qay1 surfaces in Ivanpah have a greater carbonate morphology than those described at Crater Flat (Peterson et al., 1995). This may be due to the influence of more carbonate parent material, or carbonate-containing dust input in Ivanpah as compared to Crater Flat. It is believed that most of the carbonate in the Crater Flat soils is derived from aeolian deposition (Pendall et al., 1994; Vaniman et al., 1994; Reheis, 1999). Soils forming on geomorphic surfaces older than Qay2 have carbonate morphologies significantly greater than those found in similar geomorphic positions in Crater Flat (Q2b, Q2c). These surfaces may correlate to Qai or possibly Qao in Fortymile Wash. Harden et al., (1991) report U-Th ages for Q2b that range between 120–170 ka. Unit Q2c contains three different soils, which have similar characteristics to Qai soils in Ivanpah Valley. Peterson et al., (1995) interpret Q2c as 270-800 ka, which is consistent with a late to middle Pleistocene age for Ivanpah Qai and younger Qao units. Harden et al. (1991) report U-Th ages for Q2c of 240–340 ka and < 440 ka. Crater Flat QTa contains an eroded, 3 m-thick stage IV petrocalcic horizon, which is similar to soil development in Qao and QTa surfaces in Ivanpah. Peterson et al., (1995) interpret their QTa unit as possibly spanning 110 ka to 2.0 Ma. Ivanpah Qao and QTa units are interpreted to be <700 ka to 5+(?) Ma.
Mormon Mesa Area
None of the aforementioned studies describe soils with massive, thick, stage VI carbonate horizons that characterize units Tay and Tek in the Ivanpah Valley study area. To our knowledge, the strongest regional corollary for these soils occurs on Mormon Mesa. Mormon Mesa is located approximately ~100 km north of Las Vegas, Nevada along the I-15 corridor between the towns of Moapa, Overton and Mesquite. It is a flat-topped mesa that extends north and south around the Mormon Mountains, ending in a point near Overton. The mesa extends approximately 198 m above the Virgin River on the east, and the Muddy River and Meadow Valley Wash on the west. Mormon Mesa is unique because it is capped by a ~3 to 4-m thick stage VI petrocalcic soil that has developed on Tertiary sediments of the Muddy Creek Formation. The initiation of soil formation on Mormon Mesa is believed to have begun when the lower Colorado River drainage system formed approx. 5.4 Ma (Williams, 1996; House et al., 2005, 2008; Brock and Buck, 2009).
Stage VI petrocalcic horizons in Ivanpah may be of similar or even older age. Map unit Tek is characterized by a stage VI petrocalcic horizon that has formed in aeolian sediments deposited upon basalt. Therefore, sediment deposition and soil development could have been initiated shortly after the cessation of volcanic activity. The great degree of induration of these petrocalcic horizons, coupled with continued episodic aeolian deposition (during multiple interglacial periods? or even earlier), has led to their preservation. The brecciation features diagnostic of stage VI petrocalcic horizons form from repeated cycles of erosion of overlying unconsolidated soil horizons, exposing and fragmenting portions of the petrocalcic horizon, followed by sedimentation (usually aeolian in these topographically high landforms), and reburial of the petrocalcic horizons and associated fragments (see Brock and Buck, 2009). Soil carbonate continues to accumulate and re-cements these jumbled pieces (Bachman and Machette, 1977). This process may occur multiple times, resulting in very thick, brecciated, stage VI petrocalcic horizons (Brock and Buck, 2009). In addition, the degree of each successive erosion event will control the resulting stage of carbonate development. Brecciation features in stage VI petrocalcic horizons in southern Nevada generally occur in the upper <50 cm (Brock and Buck, 2006). This indicates that previous erosion and re-cementation events have affected only the upper portion of the indurated petrocalcic horizon, and in many cases have built it upward, increasing its thickness with time. However, if erosion is severe, then the evidence of stage VI development can be erased, leaving the underlying indurated portion of the petrocalcic horizon that may only be classified as stage III. Evidence for a former stage VI petrocalcic horizon may thus only be preserved in the remaining petrocalcic fragments that litter the surface. Therefore, Tek, Tay, and portions of QTa that contain intact, thick, stage VI petrocalcic horizons may represent surfaces that are several millions of years old, and perhaps even older than Mormon Mesa.
Flood Hazard Interpretation of the Geologic Map
The geologic map (House et al., 2006) is translated into a relative flood hazard map in House (2007). This map shows a direct reclassification of the surficial geologic units into a series of relative flood hazard classes based on surface age, stability, morphology, and landscape position. A series of maps (House, 2006b through 2006h) show the same reclassification on composite 1:24,000-scale topographic base maps (fig. 20). The former map is provided for perspective on the distribution of flood hazards in the entire study area and the latter series provides detail of the entire area. The maps show the same data, only at different scales[1]. Evaluation of the GIS data set for the maps obviates the need to view on the map-by-map basis shown in the figure, but users may find the paper maps useful.

Figure 41. Relative flood hazard map of the Ivanpah Valley study area.
Download Flood Hazard Map: |
|||
Google Earth Version(.kmz) |
|||
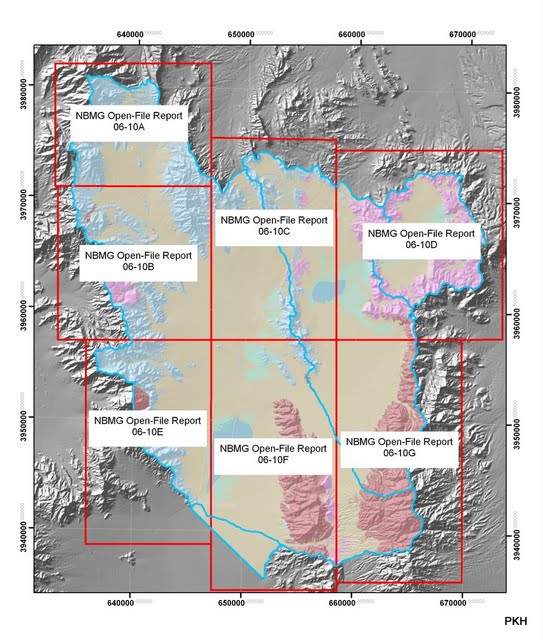
Figure 42. Areal extents of the series of 1:24,000-scale flood hazard maps.
The flood hazard classes are decidedly qualitative and are not intended to explicitly represent or supplant administrative or regulatory flood zone boundaries. They do not have specific implications of flow depths and velocities which often form the basis for actuarial assessments of flood insurance requirements, for example. The hazard zones depict the loci and spatial extent of flood hazards as inferred from geologic evidence of relative flow frequency and vigor; and surface stability and landform type (see House, 2005 for detailed discussion of this concept). Each classification represents a composite of physical properties related to surface age, stability, and geomorphic position that form the basis of the geologic map. Derivation of the relative flood hazard map is based upon the concept that the recent geologic history of the study area has direct influence on the distribution of flooding.
The classification scheme represents a cautiously conservative interpretation of the geologic evidence pertaining to surface stability. In general, all Holocene deposits (except for aeolian deposits, Qe) have been assigned to a flood hazard class greater than “very low”, including surfaces that have very likely been isolated from flooding for more than 7–10 thousand years This division is based on the fact that the suite of active Holocene-aged alluvial surfaces (Qay3, Qay2, and parts of Qay) have physical characteristics that are very distinct from all inactive surfaces in the study area (Qai, Qao, QTa, and Taf). Unit Qay1, on the other hand, though morphologically quite distinct from younger units, is assigned a “low” hazard classification for reasons explained below.
The NRC panel on alluvial fan flooding suggests that a conservative standard of distinguishing active from inactive alluvial fans is the chronologic boundary between the Pleistocene and the Holocene (in the range of 10,000 to 11,800 years ago). This time-boundary relates to a major shift in climate from glacial to interglacial, which had a profound effect on alluvial fan development that is clearly reflected in the geology of desert piedmonts in the southwest US. Unit Qay1 has distinctive surface properties that indicate prolonged stability (planar morphology, moderately tight desert pavement; moderate to dark varnish on siliceous clasts); but existing evidence suggests that its period of activity straddles the Pleistocene–Holocene boundary. Correlative alluvial units described in other studies in the general region of the Ivanpah Valley area have been dated to between about 7500 and 24,000 years (e.g., Bell et al., 1998; Sowers et al., 1986; Page et al., 2005), and the episode of accelerated deposition of aeolian dust that contributed strongly to the development of the unit’s distinctive surface morphology may have ended as recently as 5000‒4500 years ago (Anderson et al., 2002; McDonald et al., 2003; McFadden et al., 1998).
The age of Qay1 extends into the Holocene, and its associated alluvial surfaces are locally only shallowly incised by active surfaces (as little as 0.5 to 3 m, depending on local conditions and piedmont position). Therefore, this surface has been classified as having a “low” flood hazard status. This reflects a cautiously conservative characterization intended to indicate that those areas are not unequivocally free from flood hazards. However, it is clear that they have been free from active alluvial processes (i.e. flooding) for more than 5000 years and, as such, they may be relatively easy areas in which to mitigate potential flood hazards. It is notable that the Qay1 surfaces on the lower parts of the piedmont (i.e. closer to the center of the valley) are only shallowly incised and more vulnerable to overflow from active channels than they are higher on the piedmont (closer to the mountains) where incision is deeper and isolation is stronger.
The flood hazard map (House, 2006a) is a direct derivative of the geologic map (House et al., 2006), which was compiled at scales of at least 1:10,000-scale and, locally, up to 1:4,500-scale. The scale of 1:24,000 is a general standard for most geologic maps at NBMG, and a series of map panels (House, 2006b through 2006h) have been prepared at this scale. The digital data that accompany the maps can be viewed at greater scales, but 1:10,000-scale should be considered the reasonable limit based on the overall range of scales used in the compilation.
Relative flood hazard classes
Very high (geologic units Qay3 and Qp)
Areas of the most frequent and concentrated runoff including well-defined active channels; broad, gravelly, and sparsely vegetated zones of intricate distributary flow networks on active alluvial fans; alluvial fan feeder channels; local trunk drainages; and terminal playas. Processes include high-velocity, channelized flow and high-velocity sheetflow on piedmont drainages and playa perimeters. Channel boundaries and positions are generally unstable and may shift considerably during and between large flows. Central playa areas are subject to extensive, shallow inundation on a regular basis. Playa perimeters are subject to flooding from the toes of adjacent, active alluvial fans and channels. Processes of sediment erosion, transport, and deposition in these areas are vigorous and involve particle sizes ranging from coarse gravel (boulders and cobbles) to sand and silt. Corresponding surface morphology includes prominent alluvial channels, fresh gravel bars, and relatively flat gravel sheets in broad distributary flow areas and playa-fan interface areas. Gravel pavements, rock varnish, and soil development are absent or weak on surfaces in this class. Geologic deposits and surfaces in this class are latest Holocene to late Holocene in age (0 to approximately 4000 years).
Washes and fans draining high-relief parts the Lucy Gray Range, the McCullough Range (northern and southern parts), and parts of the southern Spring Mountains (in particular the Table Mountain and Potosi Mountain areas) are characterized by boulder-rich flood and debris flow deposits. Elsewhere in the study area, debris flows and boulder-rich flood deposits are typically restricted to tributary washes and fans draining high-relief mountain interior or mountain areas.
Geologic evidence indicates that areas in this hazard class convey dangerous floods most frequently and thus pose a very significant floodplain management concern.
High (geologic units Qay2 and Qpf)
Areas subject to relatively frequent, concentrated to widespread runoff. This class is commonly adjacent to and linked with areas mapped in the preceding class. It includes large areas of diffuse “very high” hazard-type zones too intricate to divide. This class includes active and intermittently active alluvial fan areas, low channel-bounding terraces, and parts of playa perimeters. Class includes areas that are vulnerable to overflow and re-occupation by active channel networks. Sediment characteristics similar to areas mapped in “very high” hazard class. These areas have a high potential to convey flow during large floods because of their proximity to highly active alluvial surfaces and because their relatively young age and low relief precludes a lower hazard determination. Channel and flow-swath boundaries and positions are generally unstable. Morphology characterized by relatively fresh bar and channel to slightly weathered bar and swale complexes; relatively flat-lying terrace surfaces adjacent to active channels, and relatively flat gravel sheets in playa fringe areas. Gravel pavements are rare but may be present on inclusions of small, older surface remnants and locally in low-lying swales. Light rock varnish may be present on siliceous surface clasts. Soil development ranges from none to weak. Yellowish-brown cambic horizon (Bw) and stage 1 calcic horizon (Bk) may be present in some areas. Geologic deposits in this class range from latest Holocene to at least late Holocene (0 to approximately 4000 years).
Geologic evidence indicates that areas in this class have high potential to convey dangerous flows during large flood events. They pose a significant floodplain management concern. A cautiously conservative interpretation of the flood hazard classes would group this class with the preceding one.
Moderate (geologic unit Qay)
Areas characterized by an intricate mixture of highly active alluvial surfaces with intermittently active or recently abandoned alluvial surfaces and small, dispersed remnants of stable alluvial surfaces. This zone includes active and recently abandoned (last 100 to few 1000s of years) alluvial surfaces, distal areas of overflow from active surfaces, and some infrequently active alluvial surfaces fed by small drainage areas. It includes stable distributary flow networks and areas of shallow sheetflow. Classification does not preclude hazardous condition but only indicates that flow is generally less frequent, less intense, less recently occurring, or that the distribution of different geologic units is too fine to map at this scale. Channel boundaries and positions range from moderately stable to unstable. Morphological characteristics include weathered bar and swale complexes with muted topography and light to moderate varnish and weathering of surface clasts; class also includes shallowly dissected remnants of older, stable surfaces interspersed among stable distributary flow networks. Classification represents a composite characteristic within the mapped areas, but may not adequately represent conditions in specific sub-areas. A more cautious interpretation of this class would upgrade it to “high.” Depending on local conditions, these areas may not convey flow, even during particularly large floods. In high relief areas, they may be subject to debris flow. Geologic deposits and surfaces in this class span an age range from latest Holocene to latest Pleistocene (0 to approximately 14,000 years; House et al., 2006).
Geologic evidence indicates that this class has moderate but variable potential to convey dangerous flow during large floods. It poses a definite floodplain management concern. A very cautiously conservative interpretation of the flood hazard classes would group this class with the preceding one(s). For this reason, we have chosen not to include it with the “variable” category.
Low (geologic units Qay1 and Qea)
Areas of stable alluvial surfaces that have been largely excluded from active alluvial fan processes for at least 5000 years. Members of this class, however, are linked too closely in space and time with areas in the high and moderate classes to assert that they are unequivocally not flood hazardous. Alluvial surfaces in this class exhibit strongly planar surfaces with moderate to strong gravel pavement development and moderately to darkly varnished surface clasts. Surface clasts of carbonate rocks are weakly to moderately etched, otherwise clast weathering is minor. Soil development associated with these surfaces is characterized by strong Av and Bw horizons and stage 1 to 2 Bk horizon development.
This class also includes broad areas of planar alluvial fan surfaces that are downwind from playas and mantled with at least 0.75 m of windblown sand that is commonly overlain by a thin and loose gravel lag. The preponderance of aeolian materials on these surfaces indicates the general absence of active alluvial fan processes. This type of feature is particularly widespread in Hidden Valley and along the north and east sides of Jean, Roach, and Ivanpah lakes. Soil development on the sand-mantled surfaces is minimal and characterized by weak cambic (Bw) and calcic (Bk stage 1) horizons.
Surface morphology, soil development, and relations to regional studies strongly suggest that surfaces in this class have not been subject to alluvial fan processes for at least the last 5000 and more likely the last 7000 to 8000 years. Flood hazards in this class are not significant except locally where members are adjacent to major active channels or where they are crossed by incised, active channels. In these areas (particularly along their lateral and upslope margins in middle and lower reaches of major fan complexes) shallow to moderate overflow or lateral erosion may be relevant concerns. Geologic deposits and surfaces in this class range in age from early Holocene to latest Pleistocene (ca. 8000 to at least 14,000 years). Based on regional comparisons described previously, it is unlikely that surfaces in this class are younger than 5000 years.
This class represents a notably lower floodplain management concern than preceding ones. They are locally vulnerable to overflow and lateral erosion.
Very Low (geologic units Qai, Qao, QTa, Tay, Qe)
This class includes geologic deposits and surfaces that do not experience alluvial fan flooding. It includes thick, actively accumulating mantles of aeolian sand and ancient, moderately to very strongly carbonate-cemented relict alluvial surfaces that have been free from active alluvial fan processes for 10,000s to 1,000,000s of years. In some cases, surfaces included in this class are so high-standing as to very obviously preclude alluvial fan flood hazards, but even the lowest-lying members exhibit surface morphology and soil development characteristics that are consistent with extremely long periods of stability, including the following: planar surface remnants with tight, darkly varnished gravel pavements that may include abundant clasts of calcrete litter; moderately to deeply weathered surface clasts (etching, pitting, and splitting); deeply furrowed planar to weakly convex surface remnants with exposed calcic soil horizons; high-standing, deeply incised fan remnants with retrograde gravel pavements on surface and sideslopes; and high-standing planar ridges underlain by massive petrocalcic soils up to 3 m thick. Aeolian features included in this class include locally thick accumulations of sand on ancient fan and bedrock surfaces, thick sand ramps that overlie steep mountain-front slopes, and some small areas of dunes.
This class does not represent a significant floodplain management concern.
Variable (geologic units Qc and Qcf)
Small areas that may have special hazardous conditions that are not linked to alluvial fan/piedmont flood hazards. This includes mixed colluvial gravel and debris flow deposits on steeply sloping hillslopes and variably active talus piles and colluvial debris cones below steep bedrock cliffs. The former situation is common on steep slopes in volcanic rocks of the McCullough Range in the Hidden Valley area, and below Table Mountain in the Southern Spring Mountains. The latter situation is mainly present in parts of the Bird Spring and Spring Mountain Ranges where steep bedrock cliffs are common. These types of units (mainly the latter type) were mapped sparingly throughout the area where they were easily distinguished on aerial photographs and other imagery.
Members of this class represent special situations and should be evaluated on an individual basis. They comprise a very small part of the map area and are often in rugged and remote settings.
Indeterminate (geologic unit Qx)
Areas that have been extensively modified by excavation; artificial fill; or commercial or industrial development. Flood hazards in these areas cannot be reasonably assessed on the basis of geologic evidence. This class includes Interstate Highway 15, the Union Pacific railroad right-of-way, borrow pits and mining operations, and developed areas in Goodsprings, Jean (including the Jean Airport and the correctional facility), and Primm.
This class represents a special situation. It may locally represent a significant floodplain management concern, but large tracts of it are obviously not flood prone.
Unmapped (geologic units Tek, Tao, TKi, Tv, MzPzs, YXg)
Areas mapped as bedrock by House et al. (2006). Locally includes small areas of active and inactive alluvial surfaces, colluvium, and minor amounts of aeolian sediment. Significant flood and debris flow hazards exist in narrow bedrock canyons and steep slopes in these areas but are too small to map. Extremely rugged topography in most bedrock areas limits, but may not always preclude potential for future commercial and suburban development.
This class may locally represent a floodplain management concern, but very large tracts of it are neither flood prone nor readily accessible.

Figure 44. Three characterizations of The Lucy Gray alluvial fan. Upper: Quickbird® satellite image; Middle: Surficial geologic map; Lower: Relative flood hazard class map.
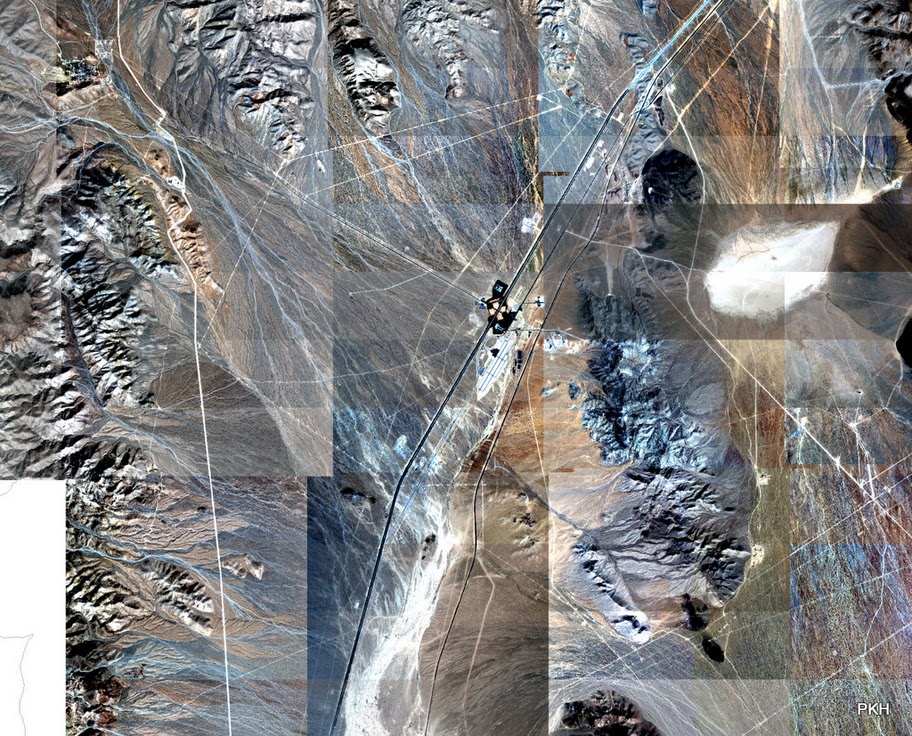
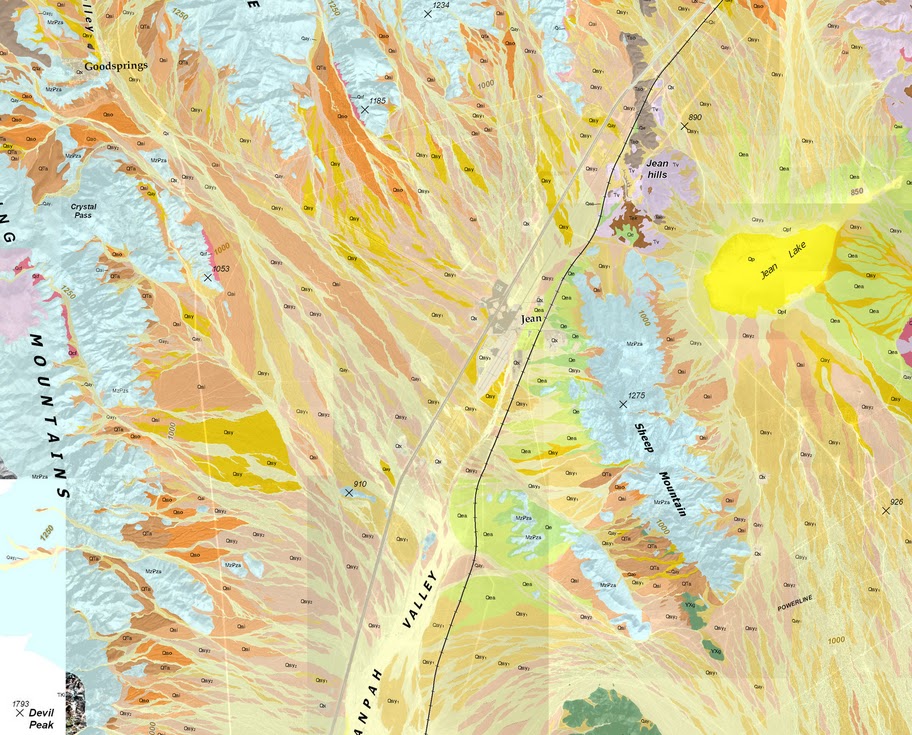
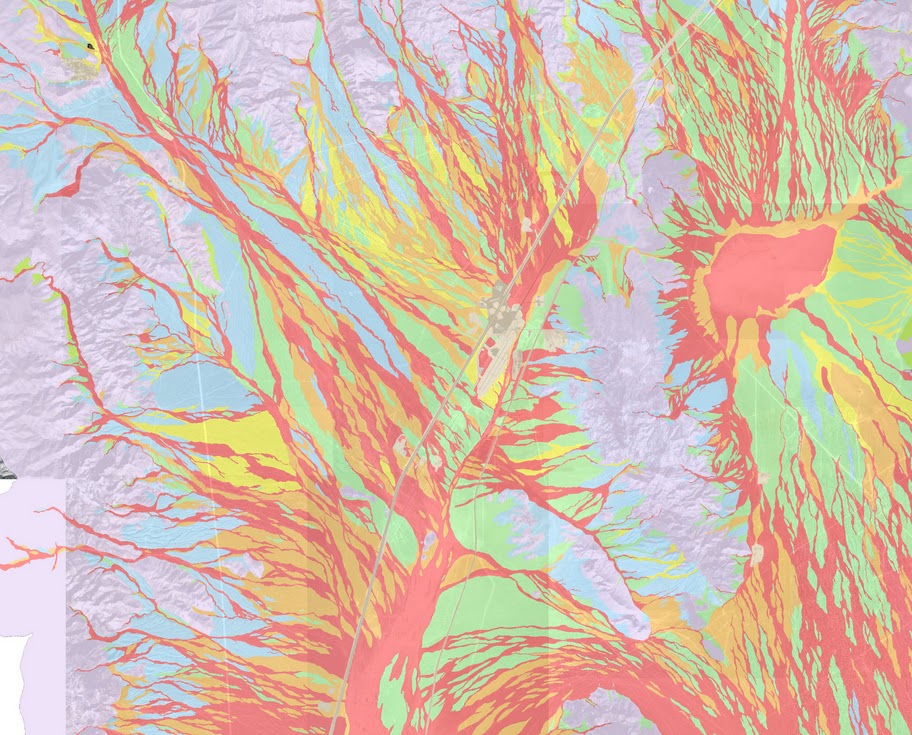
Figure 45. Three characterizations of the central study area. Upper: Quickbird® image mosaic; Lower: Relative flood hazard class map.

Figure 46. Top: Quickbird® image; middle: geologic map; bottom: derivative flood hazard map for lower part of the Goodsprings Fan.
General Geologic Assessment of Flood Hazards in the Ivanpah Valley Area
The surficial geology and geomorphic history of the Ivanpah Valley area lend themselves to a relatively straightforward assessment of relative flood hazards. We used conventional criteria to differentiate and map surficial geologic deposits on the basis of depositional process, landscape position, and relative age. We were able to bolster the relative age assignments by comparing physical characteristics of the Ivanpah Valley map units to similar units in the region with better age controls. In general, the ages of the alluvial deposits and surfaces are directly related to the duration of time that they have been isolated from active fluvial processes, hence flooding. In the case of other types of deposits (e.g., aeolian deposits, playa deposits, and hillslope deposits) evaluation of relative flood hazards was influenced by additional factors such as landscape position and process type. In the case of some hillslope deposits and certain settings with veneers of aeolian sand, the relative hazard is indeterminate. The geologically based assessment is not presented as a substitute for engineering and actuarial studies of flooding that have implications for mitigation measures and flood insurance rates; rather, it is presented solely as an informed set of baseline data to improve the focus of specific land management decisions.
Overall, the geologic and topographic diversity in the study area is conducive to a wide range of fluvial processes and related flood hazard severity, ranging from sediment-laden water floods to debris flow to prolonged inundation by standing water. The flood hazard maps (House, 2006a through 2006i) clearly indicate that even a cautiously conservative assessment of flood hazards results in a dense and intricate array of hazardous areas. However, geologic information about piedmont flood hazards often results in a lesser extent of flood hazardous areas than does the application of regulatory models in absence of geologic information (e.g., House, 2005; NRC, 1996). Ideally, the geologic data and related maps of the Ivanpah Valley areas will serve the purpose of informing hazard assessment by directing management efforts to areas where hazards clearly exist.
The scope of the problem is approximated in table 3, where the general distribution of flood hazard classes within the entire map area (all map units) and the potential hazard area (PHA—all surficial units) are listed. In total, the mapping indicates that just over 60% of the entire study area is composed of surficial geologic deposits that have broad potential to be flood hazardous (i.e. those areas given a flood hazard classification of any kind). Nearly 75% of that area (approx. 175 mi2) is classified as having a flood hazard greater than “none”; and 52% of that area (approx. 125mi2) is classified as having a flood hazard greater than “low”.
Table 3. Areal extent and relative percentage of flood hazard classes in the study area.
Hazard |
Area (sq. mi) |
% of PHA |
% of map |
Very High |
83.25 |
35% |
22% |
High |
31.28 |
13% |
8% |
Moderate |
9.45 |
4% |
2% |
Low |
48.74 |
21% |
13% |
Variable |
1.12 |
0.5% |
0.3% |
Very low |
57.69 |
24% |
15% |
Indeterminate |
4.26 |
2% |
1% |
|
235.78 |
100% |
61% |
Natural drainage patterns that are readily apparent in the geologic map and the derivative flood hazard map (House et al., 2006; House, 2007) represent the culmination of a long and complex process of geomorphic evolution. Nonetheless, the broad outline of the array of the youngest and, hence, most flood prone areas is generally stable and easy to identify. The specific patterns, recurrence frequency, and absolute magnitude of individual floods within the active areas are indeterminate with existing data, but the outlines of areas in which the flooding is most likely to transpire can be delineated on the basis of observable physical criteria. Thus, it seems clear that explicit avoidance of development in these areas would be a particularly prudent land management strategy. Aside from certain physical settings in the study area that are particularly well suited for specific types of development in spite of their flood hazards, other types of land use should be situated in ways that acknowledge the potential for flooding as expressed by observable evidence. This generalization applies to all desert piedmont settings. Superimposing a rectilinear grid on a complex landscape with very well-established and easily identifiable natural topography and drainage may not be cost-effective over the long term.
References
Al-Farraj, A., 2008, Desert pavement development on the lake shorelines of Lake Eyre (South), South Australia: Geomorphology, v. 100, p. 154–163.
Al-Farraj, A., and Harvey, A., 2000, Desert pavement characteristics on wadi terrace and alluvial fan surfaces: Wadi Al-Bih, U.A.E., and Oman: Geomorphology, v. 35, p. 279–297.
Amit, R., Enzel, Y., and Sharon, D., 2006, Permanent Quaternary hyperaridity in the Negev, Israel, resulting from regional tectonics blocking mediterranean frontal systems: Geology, v. 34, no. 6, p. 509–512.
Amit, R., Lekach, J., Ayalon, A., Porat, N., and Grodek, T., 2007, New insight into pedogenic processes in extremely arid environments and their paleoclimatic implications–the Negev Desert, Israel: Quaternary International, v. 162–163, p. 61–75.
Amundson, R.G., Chadwick, O.A., Sowers, J.M., Doner, H.E., 1989, The stable isotope chemistry of pedogenic carbonates at Kyle Canyon, Nevada: Soil Science Society of America Journal, v. 53, p. 201–210
Anderson, K., Wells, S., and Graham, R., 2002, Pedogenesis of vesicular horizons, Cima Volcanic Field, Mojave Desert, California: Soil Science Society of America Journal, v. 66, p. 878–887.
Bachman, G.O., and Machette, M.W., 1977, Calcic soils and calcretes in the southwestern U.S.: U.S. Geological Society Open-File Report 77-794, 163p.
Baker, V.R., Demsey, K.A., Ely, L.L., Fuller, J.E., House, P.K., O’Connor, J.E., Onken, J.A., Pearthree, P.A., and Vincent, K.R., 1990. Application of geologic information to Arizona flood hazard assessment, in Hydraulics and hydrology of arid lands, Richard H. French (editor). American Society of Civil Engineers, New York, pp. 621–626.
Bell, J.W., Ramelli, A.R., dePolo, C.M., Maldonado, F., and Schmidt, D.L., 1999, Geologic map of the Corn Creek Springs quadrangle, Nevada: Nevada Bureau of Mines and Geology Map 121, scale 1:24,000.
Bell, J.W., Ramelli, A.R., and Caskey, S.J., 1998, Geologic map of the Tule Springs Park quadrangle, Nevada: Nevada Bureau of Mines and Geology Map 113, scale 1:24,000.
Bingler, E.G., and Bonham, H.F. Jr., 1972, Reconnaissance geologic map of the McCullough Range and adjacent areas, Clark County, Nevada: Nevada Bureau of Mines and Geology Map 45, scale 1:125,000.
Birkeland, P.W., 1999, Soils and Geomorphology (3rd ed.): New York, Oxford University Press, 430 p.
Blair, T. C., and McPherson, J.G., 1994. Alluvial fans and their natural distinction from rivers based on morphology, hydraulic processes, sedimentary processes, and facies assemblages: Journal of Sedimentary Research A64: 450–489.
Blair, T.C., 1999a. Sedimentary processes and facies of the waterlaid Anvil Spring Canyon alluvial fan, Death Valley, California: Sedimentology, v. 46, p. 913–940.
Blair, T.C., 1999b. Sedimentology of the debris-flow-dominated Warm Spring Canyon alluvial fan, Death Valley, California: Sedimentology, v. 46, p. 941–965.
Bridwell, H.L., 1991, The Sloan sag—a mid-Miocene volcanotectonic depression, north-central McCullough Mountains, southern Nevada [MS thesis]: University of Nevada, Las Vegas, 147 p.
Brock, A., and Buck, B.J., 2005, A new formation process for calcic pendants from Pahranagat Valley, Nevada, USA, and implication for dating Quaternary landforms: Quaternary Research, v. 63, p. 359–367.
Brock, A.L., and Buck, B.J. 2006, Genesis of pisoliths and brecciation features in stage VI petrocalcic horizons, Mormon Mesa, NV, USA: 18th World Congress of Soil Science, Abstracts with program, Philadelphia, PA.
Brock, A.L. and Buck, B.J., 2009. Polygenetic development of the Mormon Mesa, NV petrocalcic horizons: Geomorphic and paleoenvironmental interpretations: Catena, 77: 65–75.
Brock, A.L., 2007. Characterization of stage VI petrocalcic horizons—S. Nevada and N.W. Arizona. Ph.D. Dissertation. University of Nevada Las Vegas, Department of Geoscience. 148 pages.
Bull, W.B., 1964. Geomorphology of segmented alluvial fans in western Fresno County, California: U.S. Geological Survey Professional Paper 352-E: 89-128
Bull, W.B., 1977. The alluvial-fan environment: Progress in Physical Geography, v. 1, p. 222–270.
Bull, W.B., 1979, Threshold of critical power in streams: Geological Society of American Bulletin, v. 90, p. 453–464.
Bull, W.B., 1991, Geomorphic response to climate change: New York, Oxford University Press, 326 p.
Burchfiel, B.C., Fleck, R.J., Secor, D.T., Vincelette, R.R., and Davis, G.A., 1974, Geology of the Spring Mountains, Nevada: Geological Society of America Bulletin, v. 85, p. 1013–1022.
Carr, M.D., and Pinkston, J.C., 1987, Geologic map of the Goodsprings District, southern Spring Mountains, Clark County, Nevada: U.S. Geological Survey Miscellaneous Field Studies Map MF-1514, scale 1:24,000.
Christenson, G.E., and Purcell, C., 1985, Correlation and age of Quaternary alluvial-fan sequences, Basin and Range province, southwestern United States, in Weide, D.L., ed., Soils and Quaternary geology of the southwestern United States: Geological Society of America Special Paper 203, p. 115–122.
Cooke RU (1970) Stone pavements in deserts. Annals Assoc. Am. Geog. 60, 560–577.
Dawdy, D.R., 1979. Flood-frequency estimates on alluvial fans. Journal of Hydraulic Engineering 105(11):1407–1412.
DeWitt, E., Anderson, J.L., Barton, H.N., Jachens, R.C., Podwysocki, M.H., Brickey, D.W., and Close, T.J., 1989, Mineral resources of the South McCullough Mountains Wilderness Study Area, Clark County, Nevada: U.S. Geological Survey Bulletin 1730-C, 24 p.
Dixon, J., 2009, Aridic soils, patterned ground, and desert pavements, in Geomorphology of desert environments, 2nd ed., A.J. Parsons, A.D. Abrahams (eds.), Springer Science, p. 101–122.
Dohrenwend, J.C., 1987. Basin and range, in Geomorphic systems of North America, William L. Graf (Editor). Geologic Society of America, Centennial Special Volume 2, Boulder, Colorado, pp. 303–342.
Durrenberger, R.W., and R.S. Ingram, 1978. Major storms and floods in Arizona, 1862–1978. Climatological Publications. Precipitation Series 4. Office of the State Climatologist, Arizona State University, Tempe, Arizona, 44 pp.
Federal Emergency Management Agency (FEMA), 1990. Fan—an alluvial fan flooding computer program: Washington, D.C.
FEMA, 2000. Guidelines for determining flood hazards on alluvial fans: Available at http://www.fema.gov/pdf/fhm/ft_afgd.pdf. Accessed on August 26, 2004.
FEMA, 2004. Flood hazard mapping—flood hazard zone designations: Available at http://www.fema.gov/fhm/fq_gen13.shtm. Accessed on August 26, 2004.
Field, J.J., 2001, Channel avulsion on alluvial fans in southern Arizona: Geomorphology, v. 37, p. 93–104.
Field, J.J., and Pearthree, P.A.,, 1997. Geomorphologic flood-hazard assessment of alluvial fans and piedmonts: Journal of Geoscience Education, v. 45, p. 27–37.
French, R.H., 1986. Flood hazard assessment on alluvial fans—an examination of the methodology, in Application and Frequency Risk in Water Resources, Vijay P. Singh (Editor), D. Reidel, Dordrecht, The Netherlands, pp. 361–375.
French, R.H., 1987. Hydraulic processes on alluvial fans: Elsevier, Amsterdam, The Netherlands.
French, R.H., 1992. Preferred directions of flow on alluvial fans: Journal of Hydraulic Engineering, 118(7):1002–1013.
French, R.H., Fuller, J.E., and Waters, S., 1993, Alluvial fans—proposed new process-oriented definitions for arid southwest: Journal of Water Resources Planning and Management v. 119, no. 5, p. 588–600.
Fuller, J.E., 1990, Misapplication of the FEMA alluvial fan model—a case history, in Hydraulics and Hydrology of Arid Lands, Richard H. French (editor). American Society of Civil Engineers, New York, pp., 367–372.
Garside, L.G., House, P.K., Burchfiel, B.C., and Rowland, S.M., 2009, Preliminary geologic map of the Jean quadrangle, Clark County, Nevada. Nevada Bureau of Mines and Geology Open-file Map 09-5, scale 1:24,000. Link to 7.2 Mb pdf file
Gatewood, J.S., Schrader, F.F., and Stackpole, M.R., 1946, Notable local floods of 1939: U.S. Geological Survey Water-Supply Paper 967.
Gile, L.H., Hawley, J.W., and Grossman, R.B., 1981, Soils and geomorphology in the Basin and Range area of southern New Mexico—guidebook to the Desert Project, New Mexico Bureau of Mines and Mineral Resources, Memoir 39. 222 p.
Gile, L.H., Peterson, F.F., and Grossman, R.B., 1966, Morphological and genetic sequences of carbonate accumulation in desert soils: Soil Science, v. 101, no. 5, p. 347–360.
Harden, J.W., Taylor, E.M., Hill, C., Mark, R.L., McFadden, L.D., Reheis, M.C., Sowers, J.M., and Wells, S.G., 1991, Rates of soil development from four soil chronosequences in the southern Great Basin: Quaternary Research, v. 35, p. 383–399.
Hay, R.L. and Wiggins, B., 1980. Pellets, ooids, sepiolite and silica in three calcretes of the southwestern United States. Sedimentology, 27: 559–576.
Helms, J. G., McGill, S. and Rockwell, T., 2003, Calibrated, late Quaternary age indices using clast rubification and soil development on alluvial surfaces in Pilot Knob Valley, Mojave Desert, southeastern California: Quaternary Research, v. 60, p. 377–393.
Hewett, D.F., 1931, Geology and ore deposits of the Goodsprings quadrangle, Nevada: U.S. Geological Survey Professional Paper 162, 172 p.
Hewett, D.F., 1956, Geology and mineral resources of the Ivanpah quadrangle, California and Nevada: U.S. Geological Survey Professional Paper 275, 172 p.
Hjalmarson, H.W., and Kemna, S.P., 1991, Flood hazards of distributary-flow areas in southwestern Arizona: U.S. Geological Survey Water-Resource Investigations Report 91-4171, 58 pp.
House, P.K., 2006a, Geologic assessment of piedmont and playa flood hazards in the Ivanpah Valley area, Clark County, Nevada: Nevada Bureau of Mines and Geology Map 158, scale 1:50,000.Link to 25 Mb pdf file
House, P.K., 2006b, Geologic assessment of piedmont flood hazards in the Ivanpah Valley part of the Cottonwood Pass and Potosi 7.5' quadrangles, Clark County, Nevada: Nevada Bureau of Mines and Geology Open-File Report 06-10A, scale 1:24,000.Link to 10 Mb pdf file
House, P.K., 2006c, Geologic Assessment of piedmont flood hazards in the Ivanpah Valley part of the Goodsprings and Shenandoah Peak 7.5' quadrangles, Clark County, Nevada: Nevada Bureau of Mines and Geology Open-File Report 06-10B, scale 1:24,000.Link to 9 Mb pdf file
House, P.K., 2006d, Geologic assessment of piedmont and playa flood hazards in the Ivanpah Valley part of the Jean and Bird Spring 7.5' quadrangles, Clark County, Nevada: Nevada Bureau of Mines and Geology Open-File Report 06-10C, scale 1:24,000. Link to 8 Mb pdf file
House, P.K., 2006e, Geologic assessment of piedmont and playa flood hazards in the Ivanpah Valley part of the Hidden Valley, Sloan, Sloan NE, and Sloan SE 7.5' quadrangles, Clark County, Nevada: Nevada Bureau of Mines and Geology Open-File Report 06-10D, scale 1:24,000. Link to 13 Mb pdf file
House, P.K., 2006f, Geologic assessment of piedmont and playa flood hazards in the Ivanpah Valley part of the State Line Pass and Ivanpah Lake 7.5' quadrangles, Clark County, Nevada: Nevada Bureau of Mines and Geology Open-File Report 06-10E, scale 1:24,000. Link to 10 Mb pdf file
House, P.K., 2006g, Geologic assessment of piedmont and playa flood hazards in the Ivanpah Valley Part of the Roach and Desert 7.5' quadrangles, Clark County, Nevada: Nevada Bureau of Mines and Geology Open-File Report 06-10F, scale 1:24,000.Link to 10 Mb pdf file
House, P.K., 2006h, Geologic assessment of piedmont flood hazards in the Ivanpah Valley part of the McCullough Pass and McCullough Mountain 7.5' quadrangles, Clark County, Nevada: Nevada Bureau of Mines And Geology Open-File Report 06-10G, scale 1:24,000.Link to 7.2 Mb pdf file
House, P.K., 2005, Using geology to improve flood hazard management on alluvial fans, an example from Laughlin, Nevada. Journal of the American Water Resources Association, v. 41, n. 6, p. 1431–1447.
House, P.K., Pearthree, P.A., and Vincent, K.R., 1991, Flow patterns, flow hydraulics and flood-hazard implications of a recent extreme alluvial-fan flood in southern Arizona. Geological Society of America Abstracts with Programs, v. 23, no. 5, p. A121.
House, P.K., Pearthree, P.A., and Vincent, K.R., 1992, Geological insights into deficiencies in federal procedures for flood hazard assessment on alluvial fans. Geological Society of America Abstracts with Programs, v. 24, no. 7, p. A-284.
House, P.K., Ramelli, A.R., and Buck, B.J., 2006, Surficial geologic map of the Ivanpah Valley area, Clark County, Nevada: Nevada Bureau of Mines and Geology Open-File Report 06-8, scale 1:50,000.
House, P.K., Pearthree, P.A., Howard, K.A., Bell, J.W., Perkins, M.E., and Brock, A.L., 2005, Birth of the lower Colorado River—stratigraphic and geomorphic evidence for its inception near the conjunction of Nevada, Arizona, and California, in Pederson, J., and Dehler, C.M., eds., Interior Western United States: Boulder, Colo., Geological Society of America Field Guide 6.
Kohl, M.S., 1978, Tertiary volcanic rocks of the Jean-Sloan area, Clark County, Nevada, and their possible relationship to carnotite occurrences in caliches [M.S. thesis]: University of California, Los Angeles, 116 p.
Lian, B., Hu, Q., Chen, J., Hi, J. and Teng, H., 2006, Carbonate biomineralization induced by soil bacterium Bacilus megaterium: Geochimica et Cosmochimica Acta, v. 70, p. 5522–5535.
Longwell, C.R., Pampeyan, E.H., Bower, B., and Roberts, R.J., 1965, Geology and mineral deposits of Clark County, Nevada: Nevada Bureau of Mines and Geology Bulletin 62, 230 p.
Ludwig, K.R., Paces, J.B., 2002, Uranium-series dating of pedogenic silica and carbonate, Crater Flat, Nevada: Geochemica et Cosmochemica Acta, v. 66, p. 487–506.
Machette, M.N., 1985, Calcic soils of the southwestern United States, in Weide, D.L., ed., Soils and Quaternary geology of the southwestern United States, Geological Society of America Special Paper 203, p. 1–21.
Matmon, A., Simhai, O., Amit, R., Haviv, I., Porat, N., McDonald, E., Benedetti, L., and Finkel, R., 2009, Desert pavement-coated surfaces in extreme deserts present the longest-lived landforms on Earth, GSA Bulletin, v. 121, no. 5/6, p. 688–697.
McDonald, E.V., McFadden, L.D., and Wells, S.G., 2003, Regional response of alluvial fans to the Pleistocene-Holocene climatic transition, Mohave Desert, California, in Y. Enzel, S.G. Wells, and N. Lancaster, eds., Paleoenvironments and Paleohydrology of the Mohave and Southern Great Basin Deserts. Boulder, CO: Geological Society of America Special Paper 368, p. 189–205.
McFadden, L.D., 1988, Climatic influences on rates and processes of soil development in Quaternary deposits of southern California: Geological Society of America Special Paper 216; p. 153–177.
McFadden, L.D., Wells, S.G., and Jercinovich, M.J., 1987, Influences of aeolian and pedogenic processes on the origin and evolution of desert pavements: Geology, v. 15., p. 504–508.
McFadden, L.D., Amundson, R.G., Chadwick, O.A., 1991, Numerical modeling, chemical and isotopic studies of carbonate accumulation in soils of arid regions—occurrence, characteristics, and genesis of carbonate, gypsum and silica accumulations in soils: Soil Science Society of America Special Publication, v. 26, p. 17–35.
McFadden, L.D., and Tinsley, J.C., 1985, The rate and depth of accumuilation of pedogenic carbonate accumulation in soils—formation and testing of a compartment model. In: D.W. Weide, (ed.), Soils and Quaternary geology of the southwestern United States, Geological Society of America Special Paper 203, p. 23–42.
McFadden, L.D., Wells, S.G., Dohrenwend, J.C., 1986, Influences of Quaternary climatic changes on processes of soil development on desert loess deposits of the Cima Volcanic Field, California: Catena, v. 13, p. 361–389.
McFadden, L.D., McDonald, E.V., Wells, S.G., Anderson, K.A., Quade, J., and Forman, S.L., 1998, The vesicular layer and carbonate collars of desert soils and pavements—formation, age and relation to climate change: Geomorphology, v. 24, p. 101–145.
McFadden, L.D., Eppes, M.C., Gillespie, A.R., and Hallet, B., 2005, Physical weathering in arid landscapes due to diurnal variation in the direction of solar heating: Geological Society of America Bulletin, v. 117, p. 161–173.
Monger, H.C. and Daugherty, L.A., 1991a. Pressure solution—possible mechanism for silicate grain dissolution in a petrocalcic horizon. Soil Science Society of America Journal, 55: 1625–1629.
Monger C.H., and Daugherty, L.A., 1991b, Neoformation of palygorskite in a southern New Mexico Aridisol: Soil Science Society of America Journal, v.55, p. 1646–1650.
Monger, C.H., and Adams, H.P., 1996, Micromorphology of calcite-silica deposits, Yucca Mountain, Nevada: Soil Science Society of America Journal, v. 60, p. 519–530.
Monger, H.C. and Kelly, E.F., 2002. Silica minerals, in Dixon, J.B. and Schulze, D.G., eds. Soil mineralogy with environmental applications. SSSA Book Series No.7. Madison, Soil Science Society of America: 611–636.
Monger, C.H., Daugherty, L.A., Lindemann, W.C., and Liddell, C.M., 1991, Microbial precipitation of pedogenic calcite: Geology, v. 19, p. 997–1000.
National Research Council (NRC), 1996, Alluvial fan flooding: National Academy Press, Washington, D.C.
Naiman, Z., Quade, J., and Patchett, J., 2000, Isotopic evidence for eolian recycling of pedogenic carbonate and variations in carbonate dust sources throughout the southwest United States: Geochimica et Cosmochimica Acta, v. 64, no. 18, p. 3099–3109.
Neal, J.T., Langer, A.M., and Kerr, P.F., 1968, Giant desiccation polygons of Great Basin playas: Geological Society of America Bulletin, v. 79, p. 69-90. DOI: 10.1130/0016-7606(1968)79[69:GDPOGB]2.0.CO;2. http://bulletin.geoscienceworld.org/cgi/content/abstract/79/1/69
Page, W.R., Lundstrom, S.C., Harris, A.G., Langenheim, V.E., Workman, J.B., Mahan, S.A., Paces, J.B., Dixon, G.L., Rowley, P.D., Burchfiel, B.C., Bell, J.W., and Smith, E.I., 2005, Geologic and geophysical maps of the Las Vegas 30’ x 60’ quadrangle, Clark and Nye Counties, Nevada, and Inyo County, California: United States Geological Survey Scientific Investigations Map 2814, scale 1:100,000.
Pearthree, P.A., 1991, Geologic insights into flood hazards in piedmont areas of Arizona: Arizona Geology, v. 21, p. 1–5.
Pelletier, J.D., M. Cline, and S. DeLong, 2007. Desert pavement dynamics—numerical modeling and field-based calibration, Earth Surface Processes and Landforms, 32, 1913–1927.
Pendall, E. G., Harden, J.W., Trumbore, S.E., and Chadwick, O.A., 1994, Isotopic approach to soil carbonate dynamics and implications for paleoclimatic interpretations: Quaternary Research, v. 42, p. 60–71.
Perry, R.S., Lynne, B.Y., Sephton, M.A, Kolb, V.A., Perry, C.C., and Staley, J.T., 2006, Baking black opal in the desert sun—the importance of silica in desert varnish: Geology, v. 34, p. 537–540.
Peterson, F.F., 1981. Landforms of the Basin and Range Province defined for soil survey. University of Nevada, Nevada Agricultural Experiment Station Technical Bulletin 28, Reno, Nevada, 52 p.
Peterson, F.F., Bell, J.W., Dorn, R.I., Ramelli, A.R., Ku, T., 1995, Late Quaternary geomorphology and soils in Crater Flat, Yucca Mountain area, southern Nevada: Geological Society of America Bulletin, v. 107, p. 379–395.
Quade, J., 2001, Desert pavements and associated rock varnish in the Mojave Desert—how old can they be?: Geology, v 29, no. 9., p. 855–858.
Rech, J.A., Quade, J., and Hart, W.S., 2003, Isotopic evidence for the origin of Ca and S in soil gypsum, anhydrite, and calcite in the Atacama Desert, Chile: Geochimica et Cosmochimica Acta, v. 67, p. 575–586, doi: 10.1016/S0016-7037(02)01175-4.
Reheis, M.C., Goodmacher, J.C., Harden, J.W., McFadden, L.D., Rockwell, T.K., Shroba, R.R., Sowers, J.M., and Taylor, E.M., 1995, Quaternary soils and dust deposition in southern Nevada and California: Geological Society of America Bulletin, 107, p. 1003–1022.
Reheis, M., 1988. Pedogenic replacement of aluminosilicate grains by CaCO3 in Ustollic Haplargids, south-central Montana, U.S.A. Geoderma, 41: 243–261.
Reheis M.C., 1999, Dust deposition and its effect on soils; a progress report, in Desert winds—monitoring wind-related surface processes in Arizona, New Mexico, and California, in Breed, C.S. and Reheis, M.C., eds., U.S. Geological Survey Professional Paper, P1598, p. 121–131.
Reheis, M.C., Sowers, J.M., Taylor, E.M., McFadden, L.D., Harden, J.W., 1992, Morphology and genesis of carbonate soils on the Kyle Canyon fan, Nevada, U.S.A.: Geoderma 52, p. 303–342.
Rhoads, B.L., 1986. Flood hazard assessment for land-use planning near desert mountains. Environmental Management, v. 10, no. 1, p. 97–106.
Ritter, J.B., Miller, J.R., Enzel, Y., and 14 others, 1993, Quaternary Evolution of Cedar Creek alluvial fan, Montana: Geomorphology v. 8, p. 287–304.
Ritter, J.B., Miller, J.R., Enzel, Y., and Wells, S.G., 1995, Reconciling the roles of tectonism and climate in Quaternary alluvial fan evolution: Geology, v. 23, p. 245–248.
Robins, C.R., Buck, B.J., Williams, A.J., Morton, J.L., House, P.K., Howell, M.S., and Yonovitz, M.L., 2009, Comparison of flood hazard assessments on desert piedmonts and playas—a case study in Ivanpah Valley, Nevada: Geomorphology, v. 103, no. 4, p. 520–532.
Robins, C., Buck, B.J., Spell, T., Soukup, D., 2008, Micromorphology of sepiolite, palygorskite, and other phyllosilicates in petrocalcic soils of the southwest USA: Implications for arid soil dating, Abstracts of the 13th International Conference on Soil Micromorphology, Sept. 11–16, Chengdu China, p. 119.
Schmidt, K.M., and McMackin, M., 2006, Preliminary surficial geologic map of the Mesquite Lake 30’ x 60’ quadrangle, California and Nevada: U.S. Geological Survey Open-File Report 2006-1305, scale 1:100,000, 55 p.
Sowers, J.M., Harden, J.W., Robinson, S.W., McFadden, L.D., Amundson, R.G., Jull, A.J.T., Reheis, M.C., Taylor, E.M., Szabo, B.J., Chadwick, O.A., Ku, T.L., 1988, Geomorphology and pedology on the Kyle Canyon alluvial fan, southern Nevada., in Weide, D.L. and Faber, M.L., eds., This Extended Land, Geological Journeys in the Southern Basin and Range, Geological Society of America Cordilleran Section, Field Trip Guidebook, pp. 137–157.
Taylor, E.M., 1986, Impact of time and climate on Quaternary soils in the Yucca Mountain area of the Nevada Test Site [M.S. thesis]:University of Colorado, Boulder, CO., 217 p.
Toutin, T. and Cheng, P., 2002, Quickbird®—a milestone for high-resolution mapping: Earth Observation Magazine, no. 11, v. 4. Available online: (http://www.eomonline.com/ Common/currentissues/Apr02/cheng.htm); last accessed August 1, 2006.
Treadwell-Steitz, C., and McFadden, L.D., 2000, Influence of parent material and grain size on carbonate coatings in gravelly soils, Palo Duro Wash, New Mexico: Geoderma, v. 94, p. 1–22.
U.S. Geological Survey Geologic Names Committee (USGSGNC) 2007, Divisions of geologic time—Major chronostratigraphic and geochronologic units: U.S. Geological Survey Fact Sheet 2007-3015, 2 p. http://pubs.usgs.gov/fs/2007/3015/
(USGSGNC, 2007; ICS, 2008) (http://www.stratigraphy.org/upload/ISChart2009.pdf)
Valentine, G., and Harrington, C., 2006, Clast size controls and longevity of Pleistocene desert pavements at Lathrop Wells and Red Cone volcanoes, southern Nevada: Geology, v.34, no. 7, p. 533–536.
Vaniman, D.T., Chipera S.J., Bish, D.L., 1994, Pedogenesis of siliceious calcretes at Yucca Mountain, Nevada: Geoderma, v. 63, p. 1–17.
Watts, N.L., 1978, Displacive calcite: evidence from recent and ancient calcretes: Geology, v. 6, p. 699–703.
Watts, N.L., 1980. Quaternary pedogenic calcretes from the Kalahari (southern Africa): mineralogy, genesis and diagenesis. Sedimentology, 27: 661–686.
Wells, S.G., Dohrenwend, J.C., McFadden, L.D., Turin, B.D., and Mahrer, K.D., 1985, Late Cenozoic landscape evolution on lava flow surfaces of the Cima volcanic field, Mojave Desert, California: Geological Society of America Bulletin, v. 96, p. 1518–1529.
Williams, V., 1996, Preliminary geologic map of the Mesquite quadrangle, Clark and Lincoln counties, Nevada and Mojave county Arizona: U.S. Geological Survey Open-File Report 96-0678, scale 1:24,000, 12p.
Whitney, J.W., Taylor, E.M., and Wesling, J.R., 2004, Quaternary stratigraphy and mapping in the Yucca Mountain area, in Keefer, W.R., Whitney, J.W., and Taylor, E.M., eds., Quaternary paleoseismology and stratigraphy of the Yucca Mountain area, Nevada, U.S. Geological Survey Professional Paper 1689: Reston, Virginia, p. 11–23.
Wood, Y., Graham, R., and Wells, S., 2005, Surface control of desert pavement pedologic process and landscape function, Cima Volcanic field, Mojave Desert, California: Catena v. 59, p. 205–230.
Suggested Citations
Online version:
House, P.K., Buck, B.J., and Ramelli, A.R., 2010, Geologic assessment of piedmont and playa flood hazards in the Ivanpah Valley area, Clark County, Nevada (online version): Nevada Bureau of Mines and Geology Report 53.
DVD version:
House, P.K., Buck, B.J., and Ramelli, A.R., 2010, Geologic assessment of piedmont and playa flood hazards in the Ivanpah Valley area, Clark County, Nevada (DVD version): Nevada Bureau of Mines and Geology Report 53.
Acknowledgments
This research was supported by the Clark County Regional Flood Control District, the United States Geological Survey (Statemap program), the Nevada Bureau of Mines and Geology (UNR), and the University of Nevada, Las Vegas. The authors gratefully acknowledge the following individuals who contributed in various ways to the collection, interpretation, and presentation of the data: Brien Park, Amy Brock, Tom Prescott, Andrew Hanson, Doug Merkler, Robert Chaney, Ron Hess, Liz Crouse, Christine Arritt, Dick Meeuwig, and Gary Johnson. Thanks to John Bell, Gale Fraser, John Hawley, and Philip Pearthree for constructive reviews of the report.
Appendix 1. Explanation of digital data sets associated with this report
Project DVD / Online Data
A project DVD is available that contains all of the digital data used in developing the maps described in this report, including: geologic data geodatabase; field point and photo geodatabase; *mxd files used in ArcMap to display and print the maps; layer files (*.lyr) that ensure the data are displayed the appropriate way; and *.pdf files of each map (plates 1–9). Contact the NBMG Publication Sales Office to inquire about the DVD.
Project Geodatabases in ESRI *.mdb format

All of the geologic data have been complied in two ArcGIS personal geodatabases. The primary geodatabase, Ivanpah_u83_final.mdb contains all of the data used to develop the geologic map and the derivative flood hazard maps. The secondary geodatabase, IV_geo_pts_final_u83.mdb, contains field site locations and a set of linked field photographs. The general database structure is shown below (for additional details view the metadata that accompanies the geodatabase on the data DVD included with this report):
Ivanpah_u83_final.mdb
IV_basedata (basemap data)
Anno_388_413internal file related to labeling)
IV_dlg_contour50 meter contours from 100k dataset)
IV_dlg_contour_floodAnno(contour labels for flood map)
IV_dlg_contour_geoAnno(contour labels for geologic map)
IV_elevation_pt(spot elevation locations for selected points)
IV_elevation_ptAnno(spot elevation labels)
IV_hydro_units(playa watershed polygons)
IV_mapbnd_cottonwoodpass
(clipping boundary for 24k flood map)
IV_mapbnd_goodsprings
(clipping boundary for 24k flood map)
IV_mapbnd_hiddenvalley
clipping boundary for 24k flood map)
IV_mapbnd_jean
clipping boundary for 24k flood map)
IV_mapbnd_mcculloughpass
clipping boundary for 24k flood map)
IV_mapbnd_roach
clipping boundary for 24k flood map)
IV_mapbnd_statelinepass
clipping boundary for 24k flood map)
IV_miscAnno(labels for geographic features in map area)
IV_mojmtf_linestransmission lines)
IV_mojrdf_lines(roads)
IV_railroad_lines(railroad)
IV_tr_lines(township and range grid lines)
IV_geology(Feature class—geologic unit contacts, polygons, and labels)
Anno_346_370
IV_geo_linesgeologic contacts)
IV_geo_unitAnno(geologic unit labels)
IV_geo_units(geologic unit polygons, includes flood-related attribution)
IV_hydro_lines(watershed outlines)
NV_basedata(base data for Nevada index map)
Anno_407_409internal file related to labeling)
NV_24kquadsboundaries of 7.5’ / 24k quadrangles)
NV_24kquadsAnnoquadrangle names)
NV_counties(Nevada county outlines)
IV_basin_shrel_gridelevation grid for study area)
IV_outsidebasin_grid(elevation grid for area outside of study area)
IV_shrel_grid(elevation grid for entire map area)
Geodatabase of Field Photographs (ESRI format)
IV_geo_pts_final_u83.mdb
IV_field_points (field point dataset)
IV_ar_pts_06Alan Ramelli, NBMG)
IV_kh_pts_06(Kyle House, NBMG)
IV_photo_pts(points with linked photos)
To view the photos:
Open the feature class “IV_photo_pts” in ArcMap or ArcCatalog. Click the “i” button (blue circle with white “i”). Click on a point. On the right side of the newly-popped-up-window, scroll down to the “raster_no” field. If there is a button with a greater than symbol, click on it. You will see the photo for that site (if the field is “<null>”, there is no photo available). To view a larger image, right-click in the image and select “view”. This will pop-out another window for you to zoom-in or out, pan, and view properties of the image. To close the window, hit the “x” in the upper right corner.
A selection of field photographs is also available online in the browser-based Google Earth viewer below.
View larger map


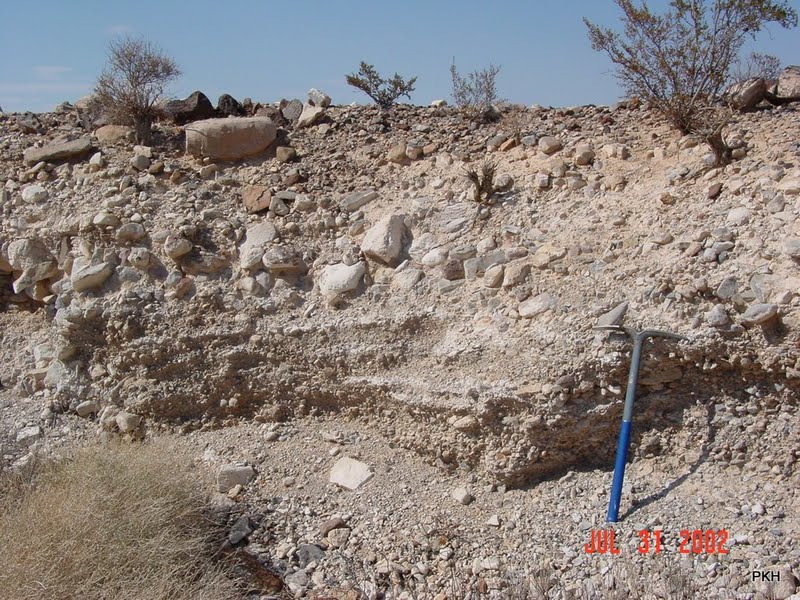
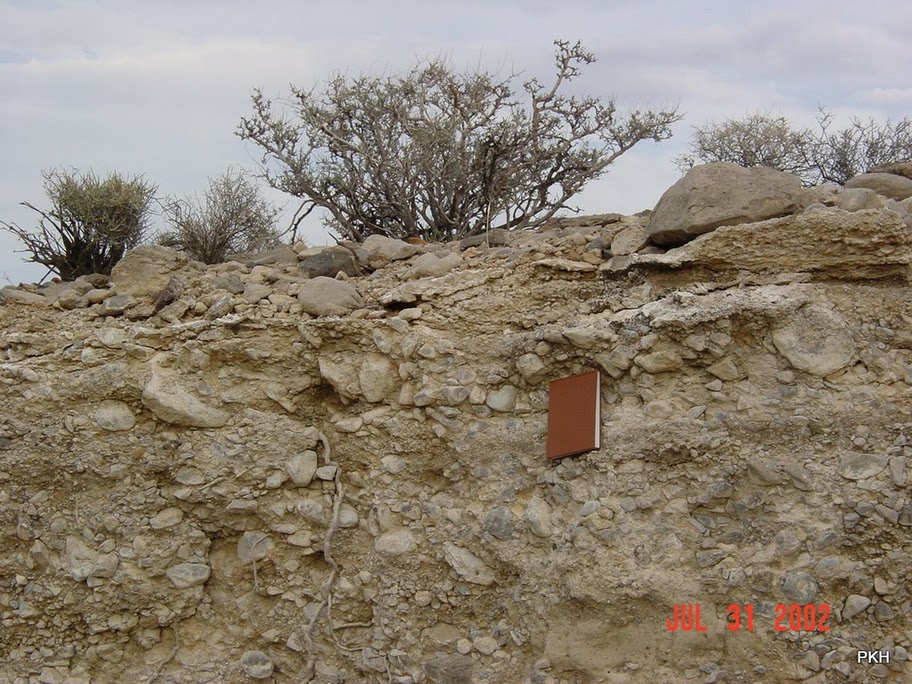
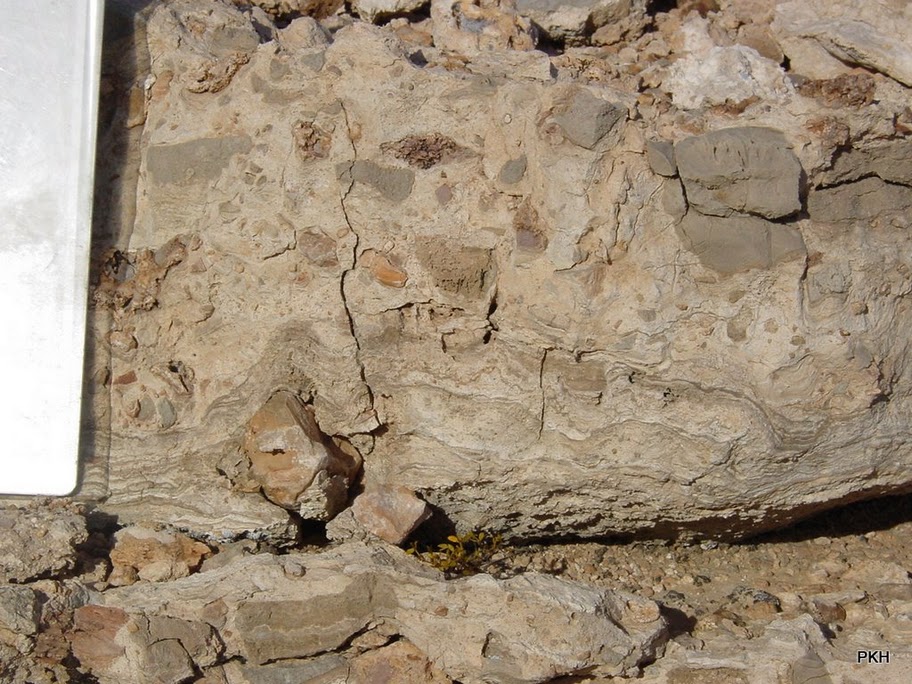
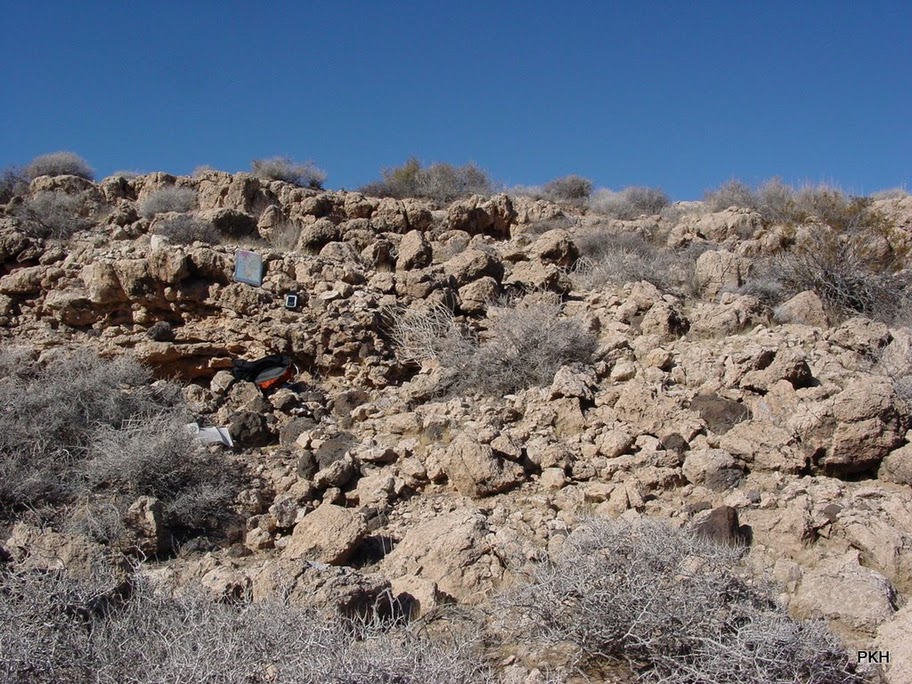

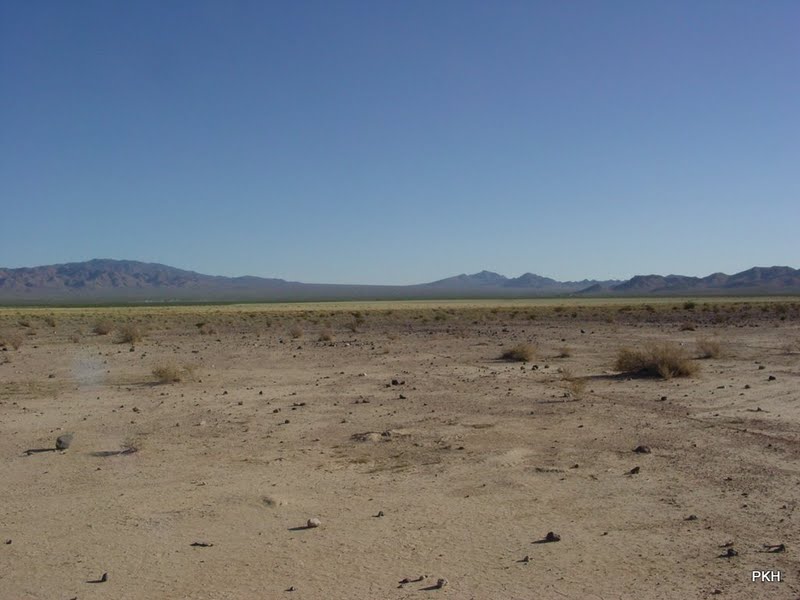

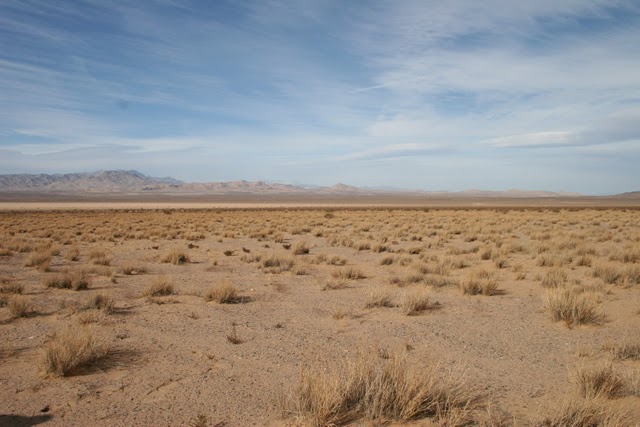
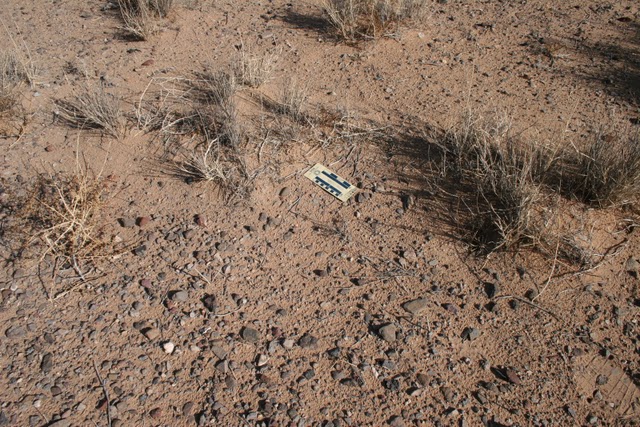
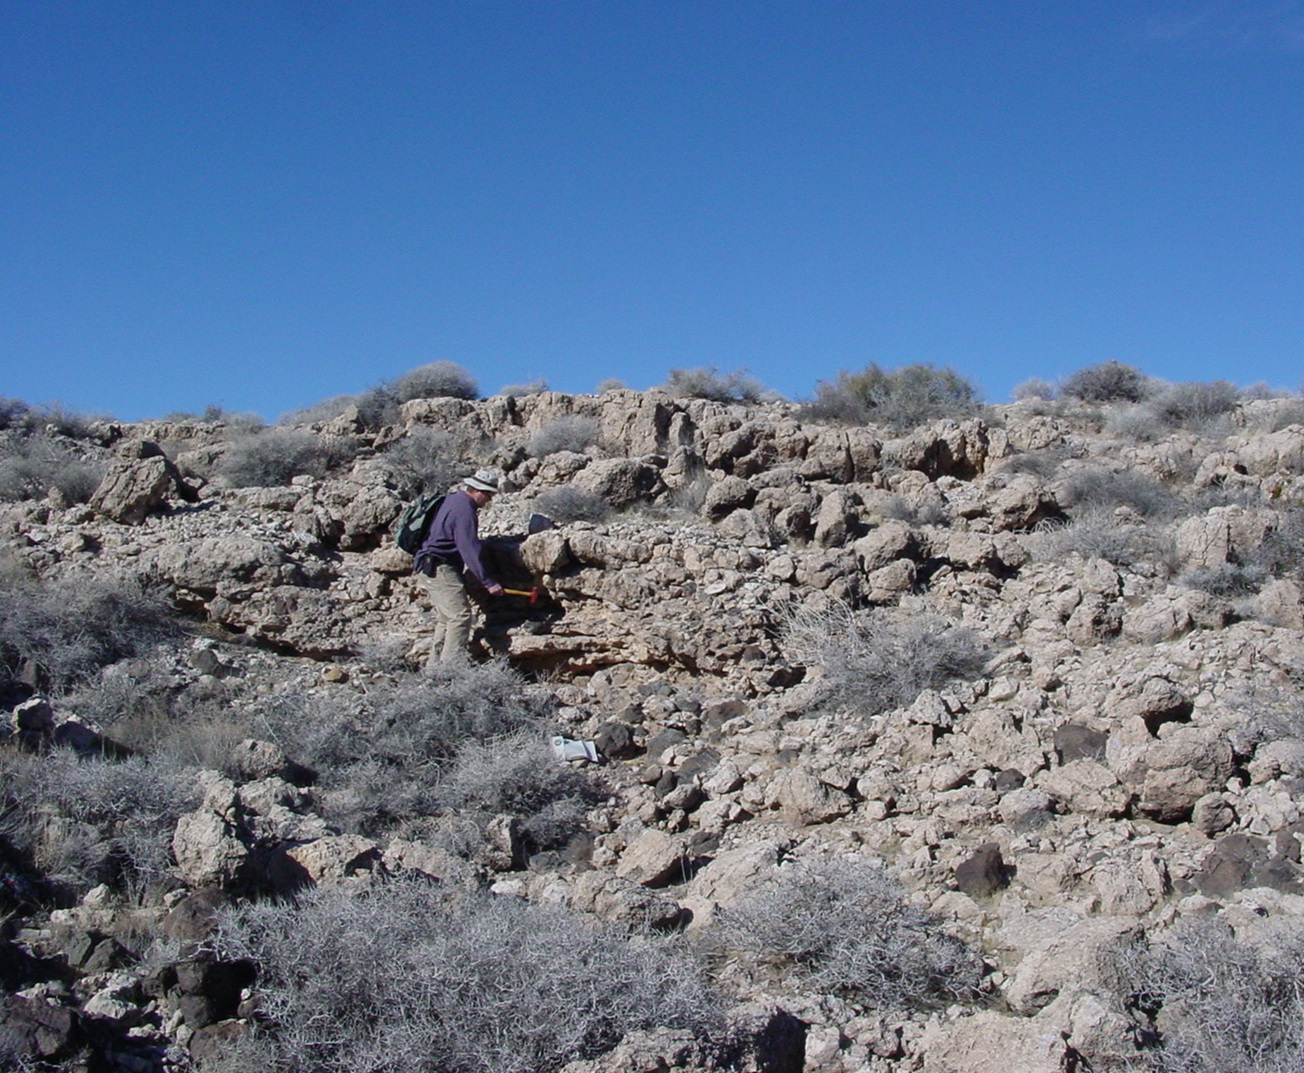
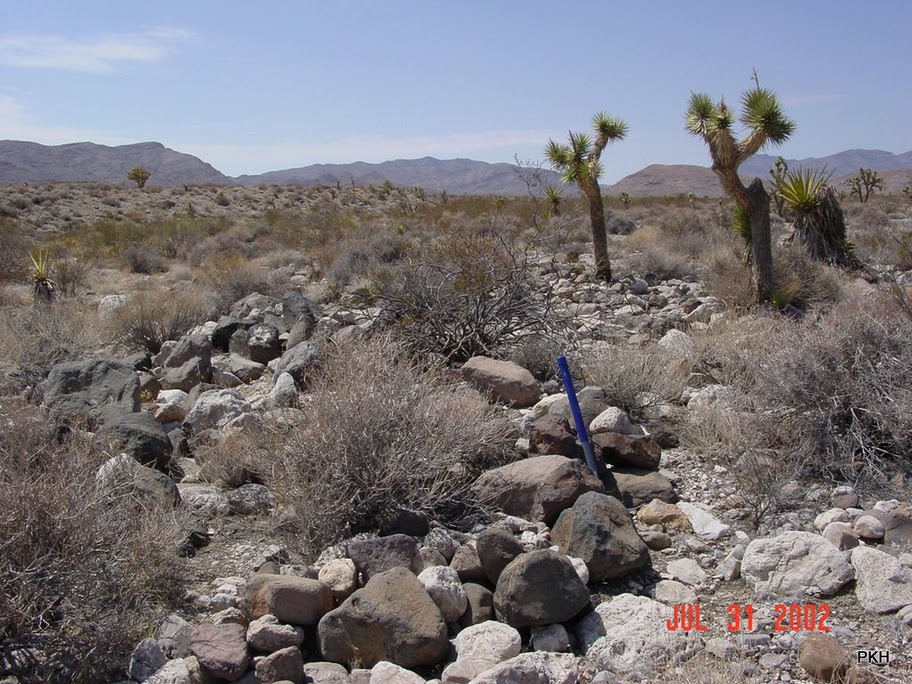
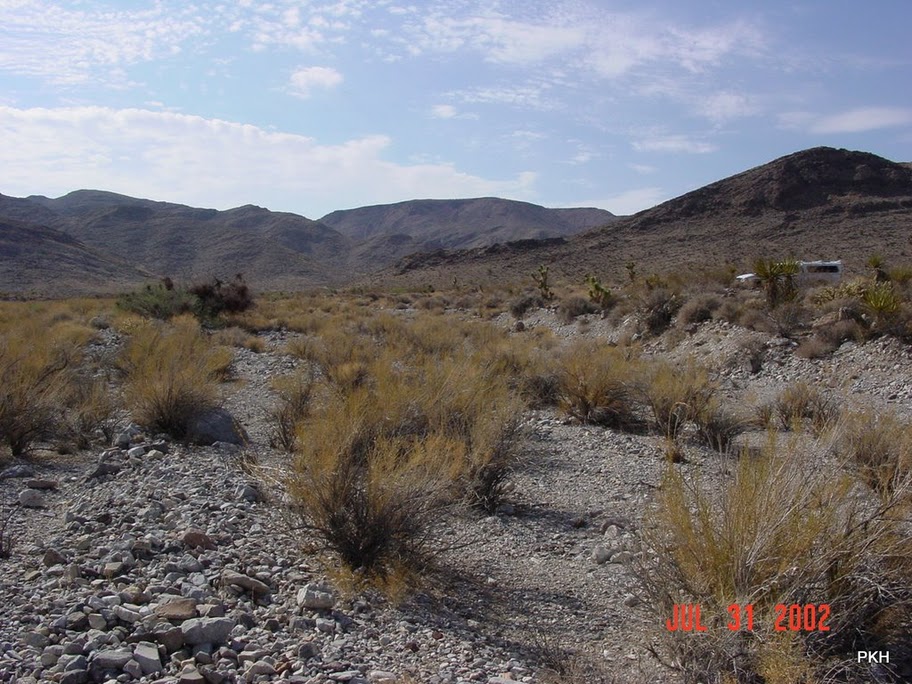

 Home
Home